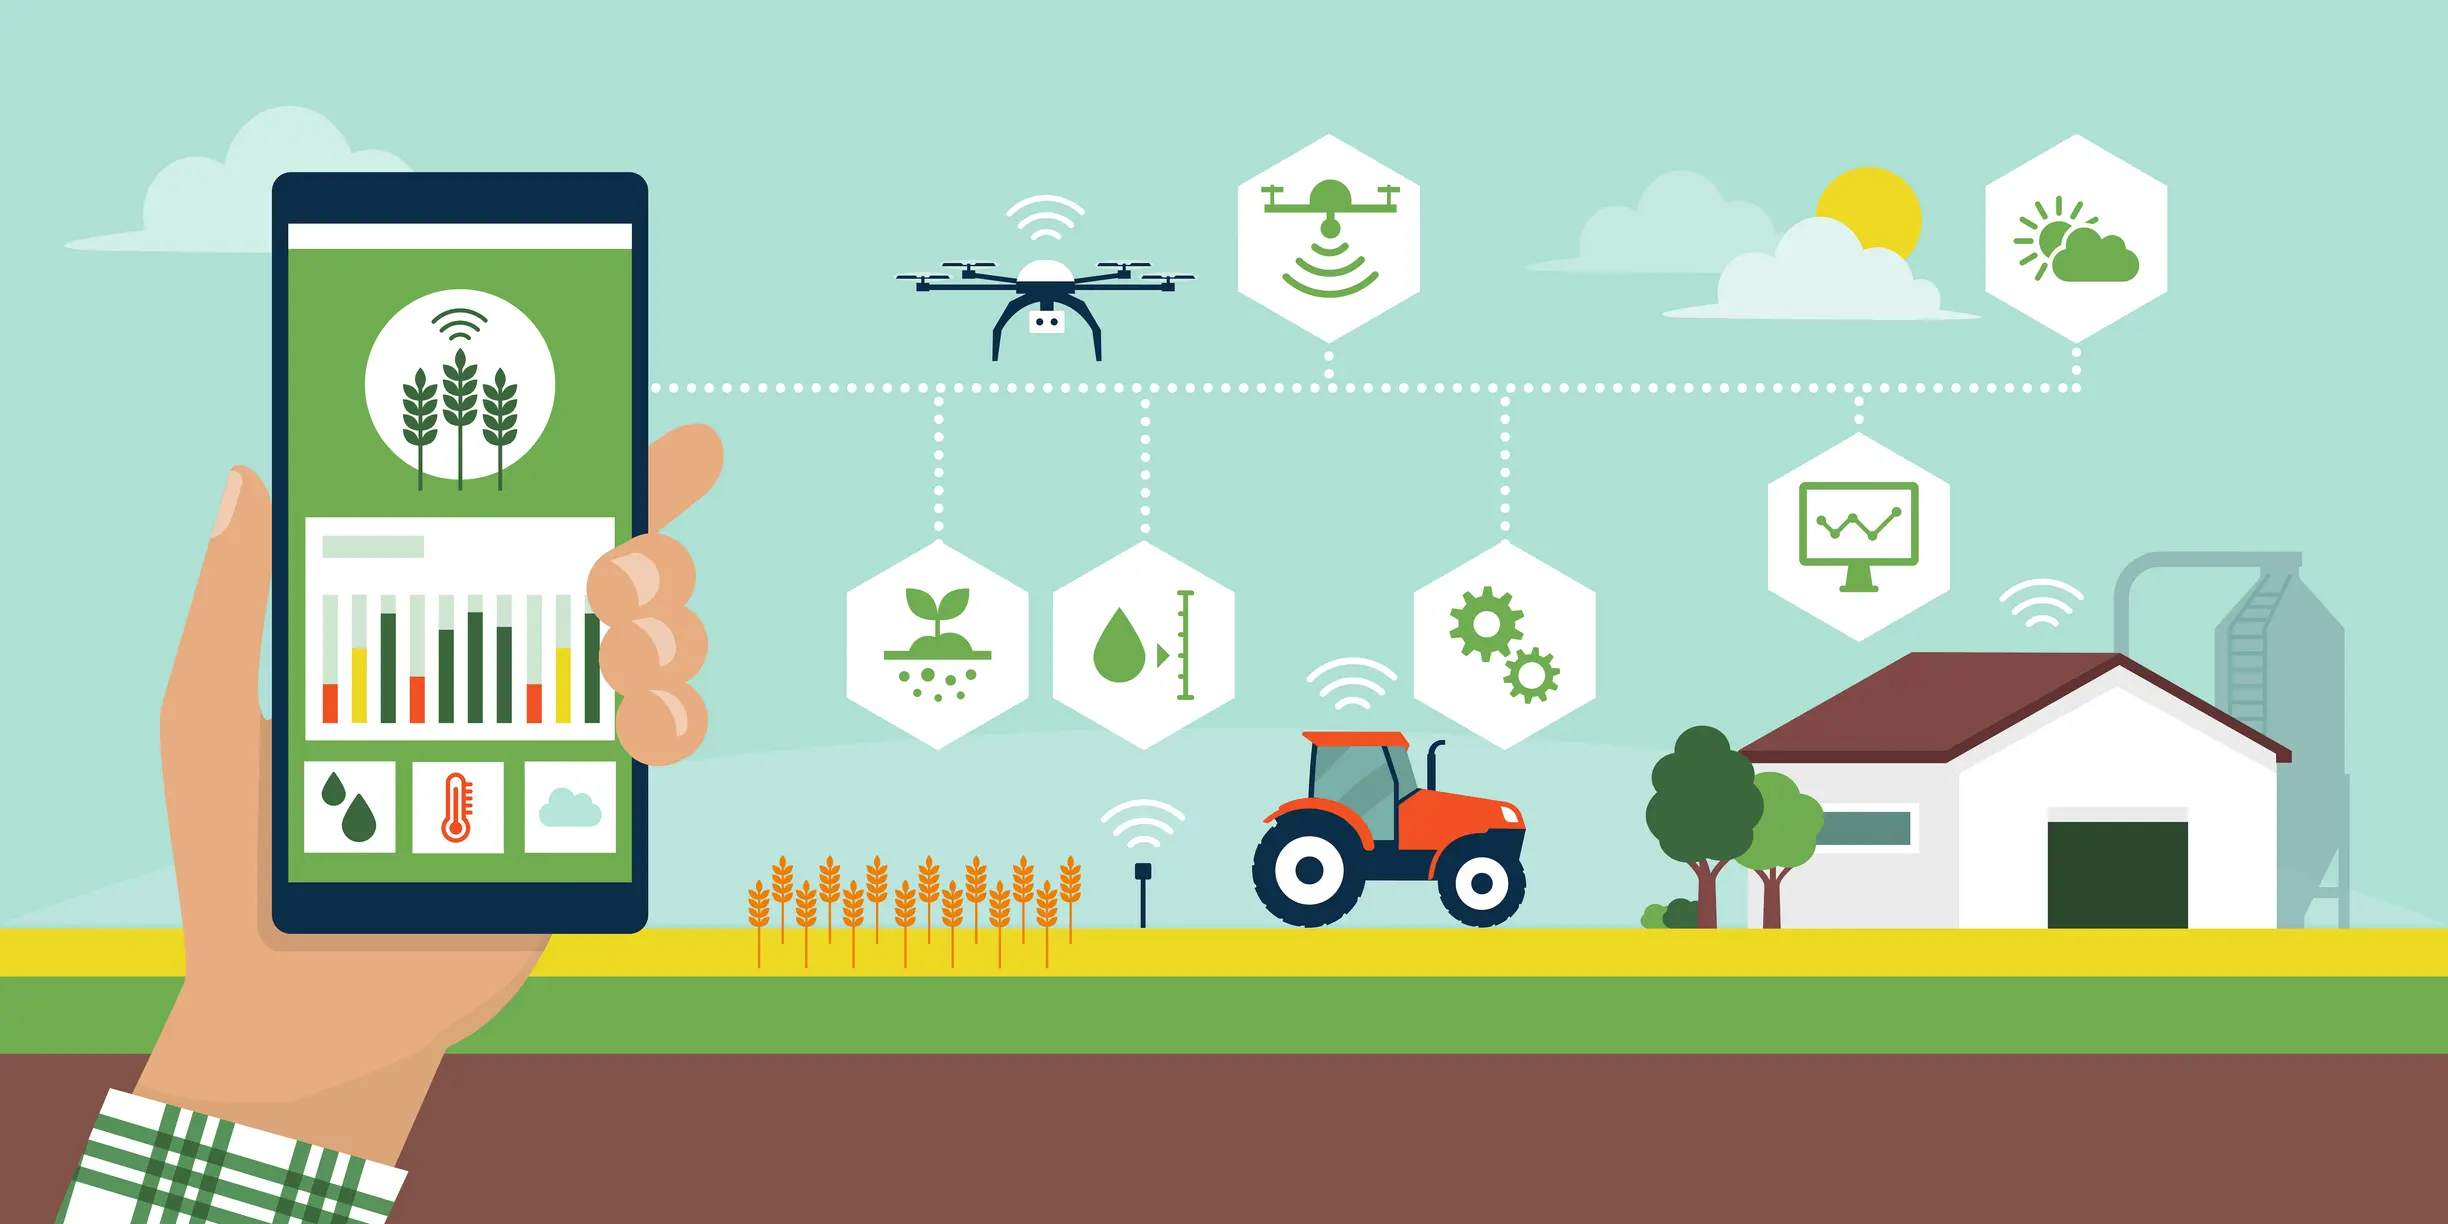
A recent USDA report defined the Components of Digital Agriculture (DA) as falling into three categories:
Data and Data Collection Systems
Decision Support Tools
Data-Driven Equipment and Input Adjustments

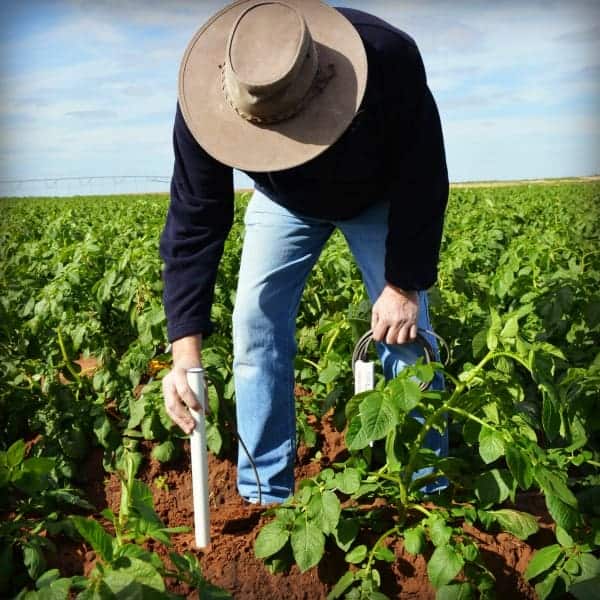
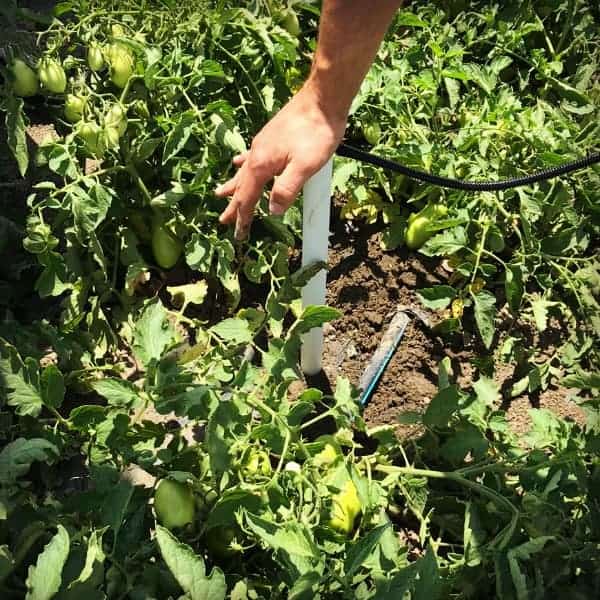
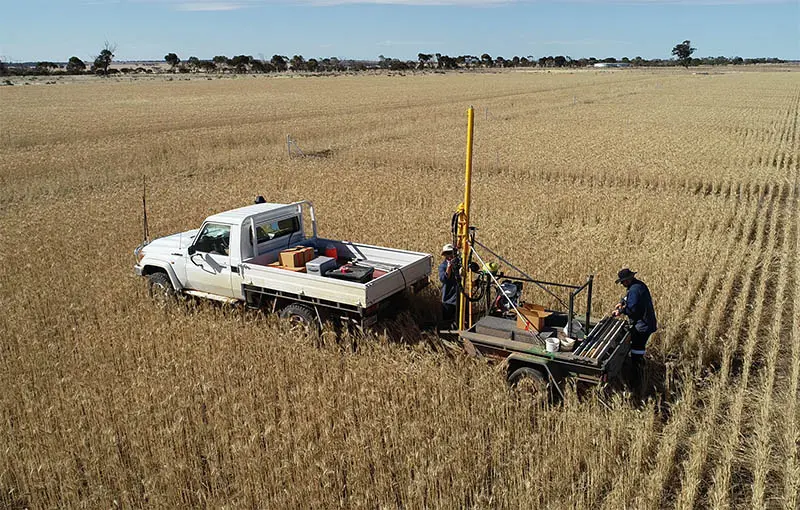
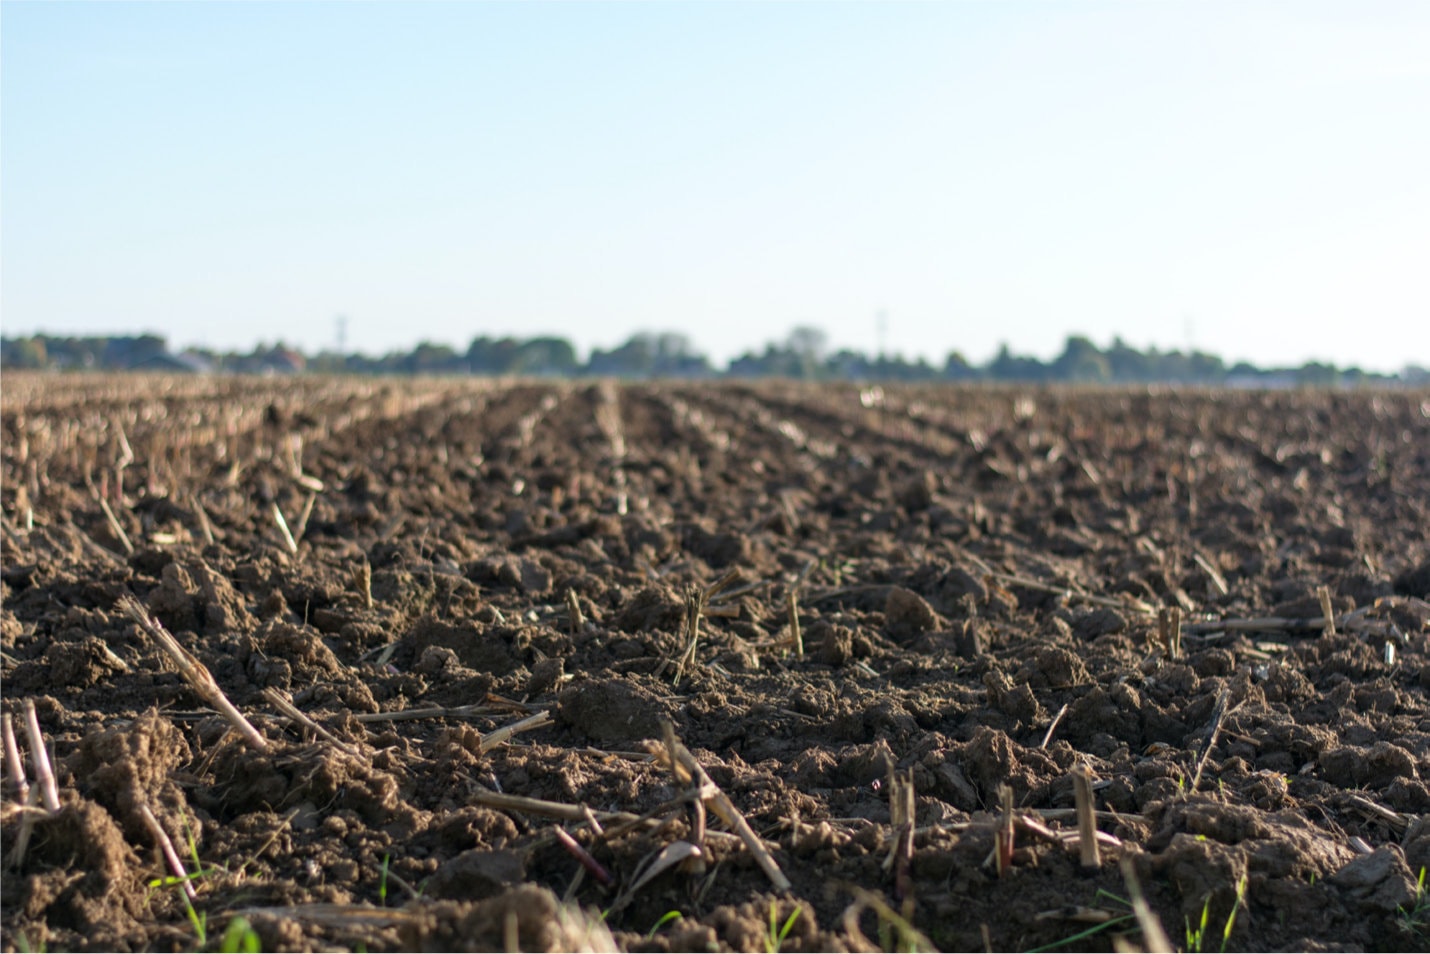
Traditional soil sampling methods in agriculture, crucial for assessing soil health and fertility, face many operational limitations. These methods are time-consuming and labour-intensive, involving manual collection and analysis, which can be costly and challenging, especially for large operations. This can often lead to reducing the number of samples taken which may fail to capture the field's spatial variability due to limited sampling points, leading to potentially inaccurate soil health assessments.
Additionally, the practice of extrapolating limited sample data to represent entire fields can introduce inaccuracies due to soil heterogeneity, risking inappropriate application of agricultural inputs like fertilisers and water
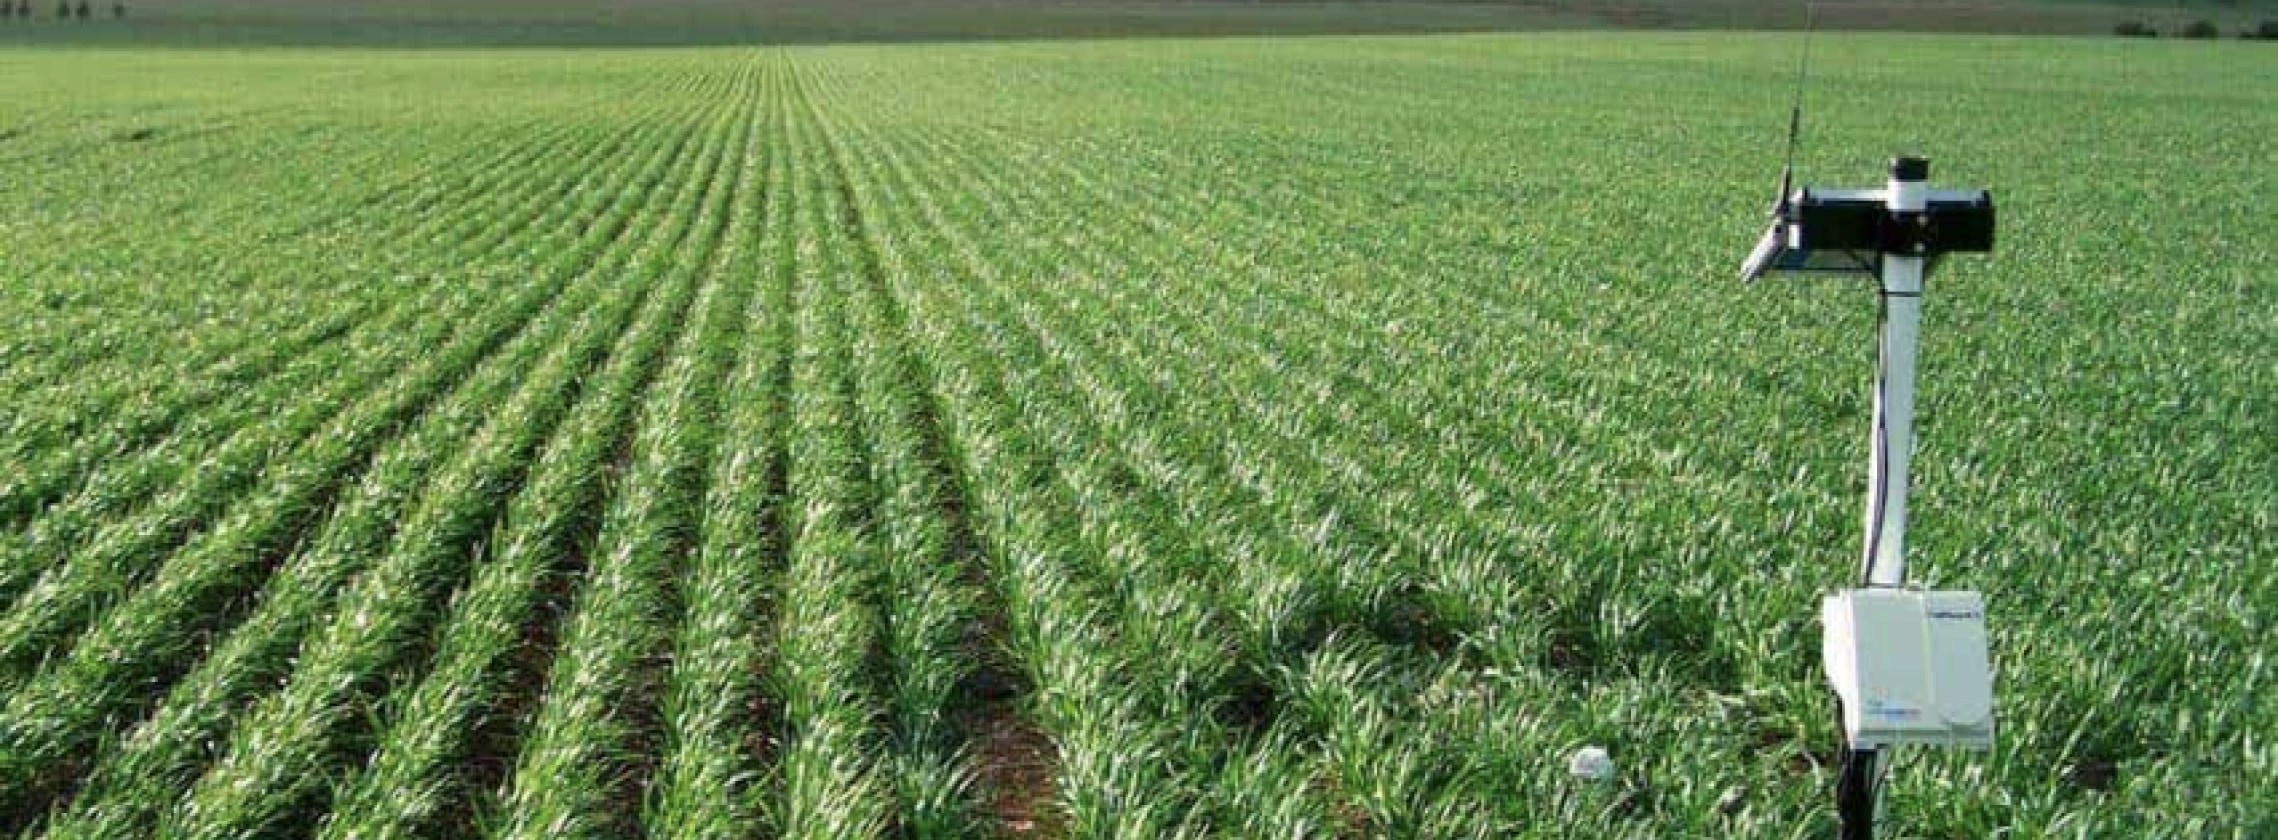
Digital agriculture leverages advanced, cost-effective technologies for scalable soil monitoring, employing both stationary probes and spatial sensing to assess soil conditions like moisture, temperature, and pH.
Integrating new data and GIS mapping software enables precise field mapping and zoning, highlighting soil variations to guide targeted sampling and informed management.
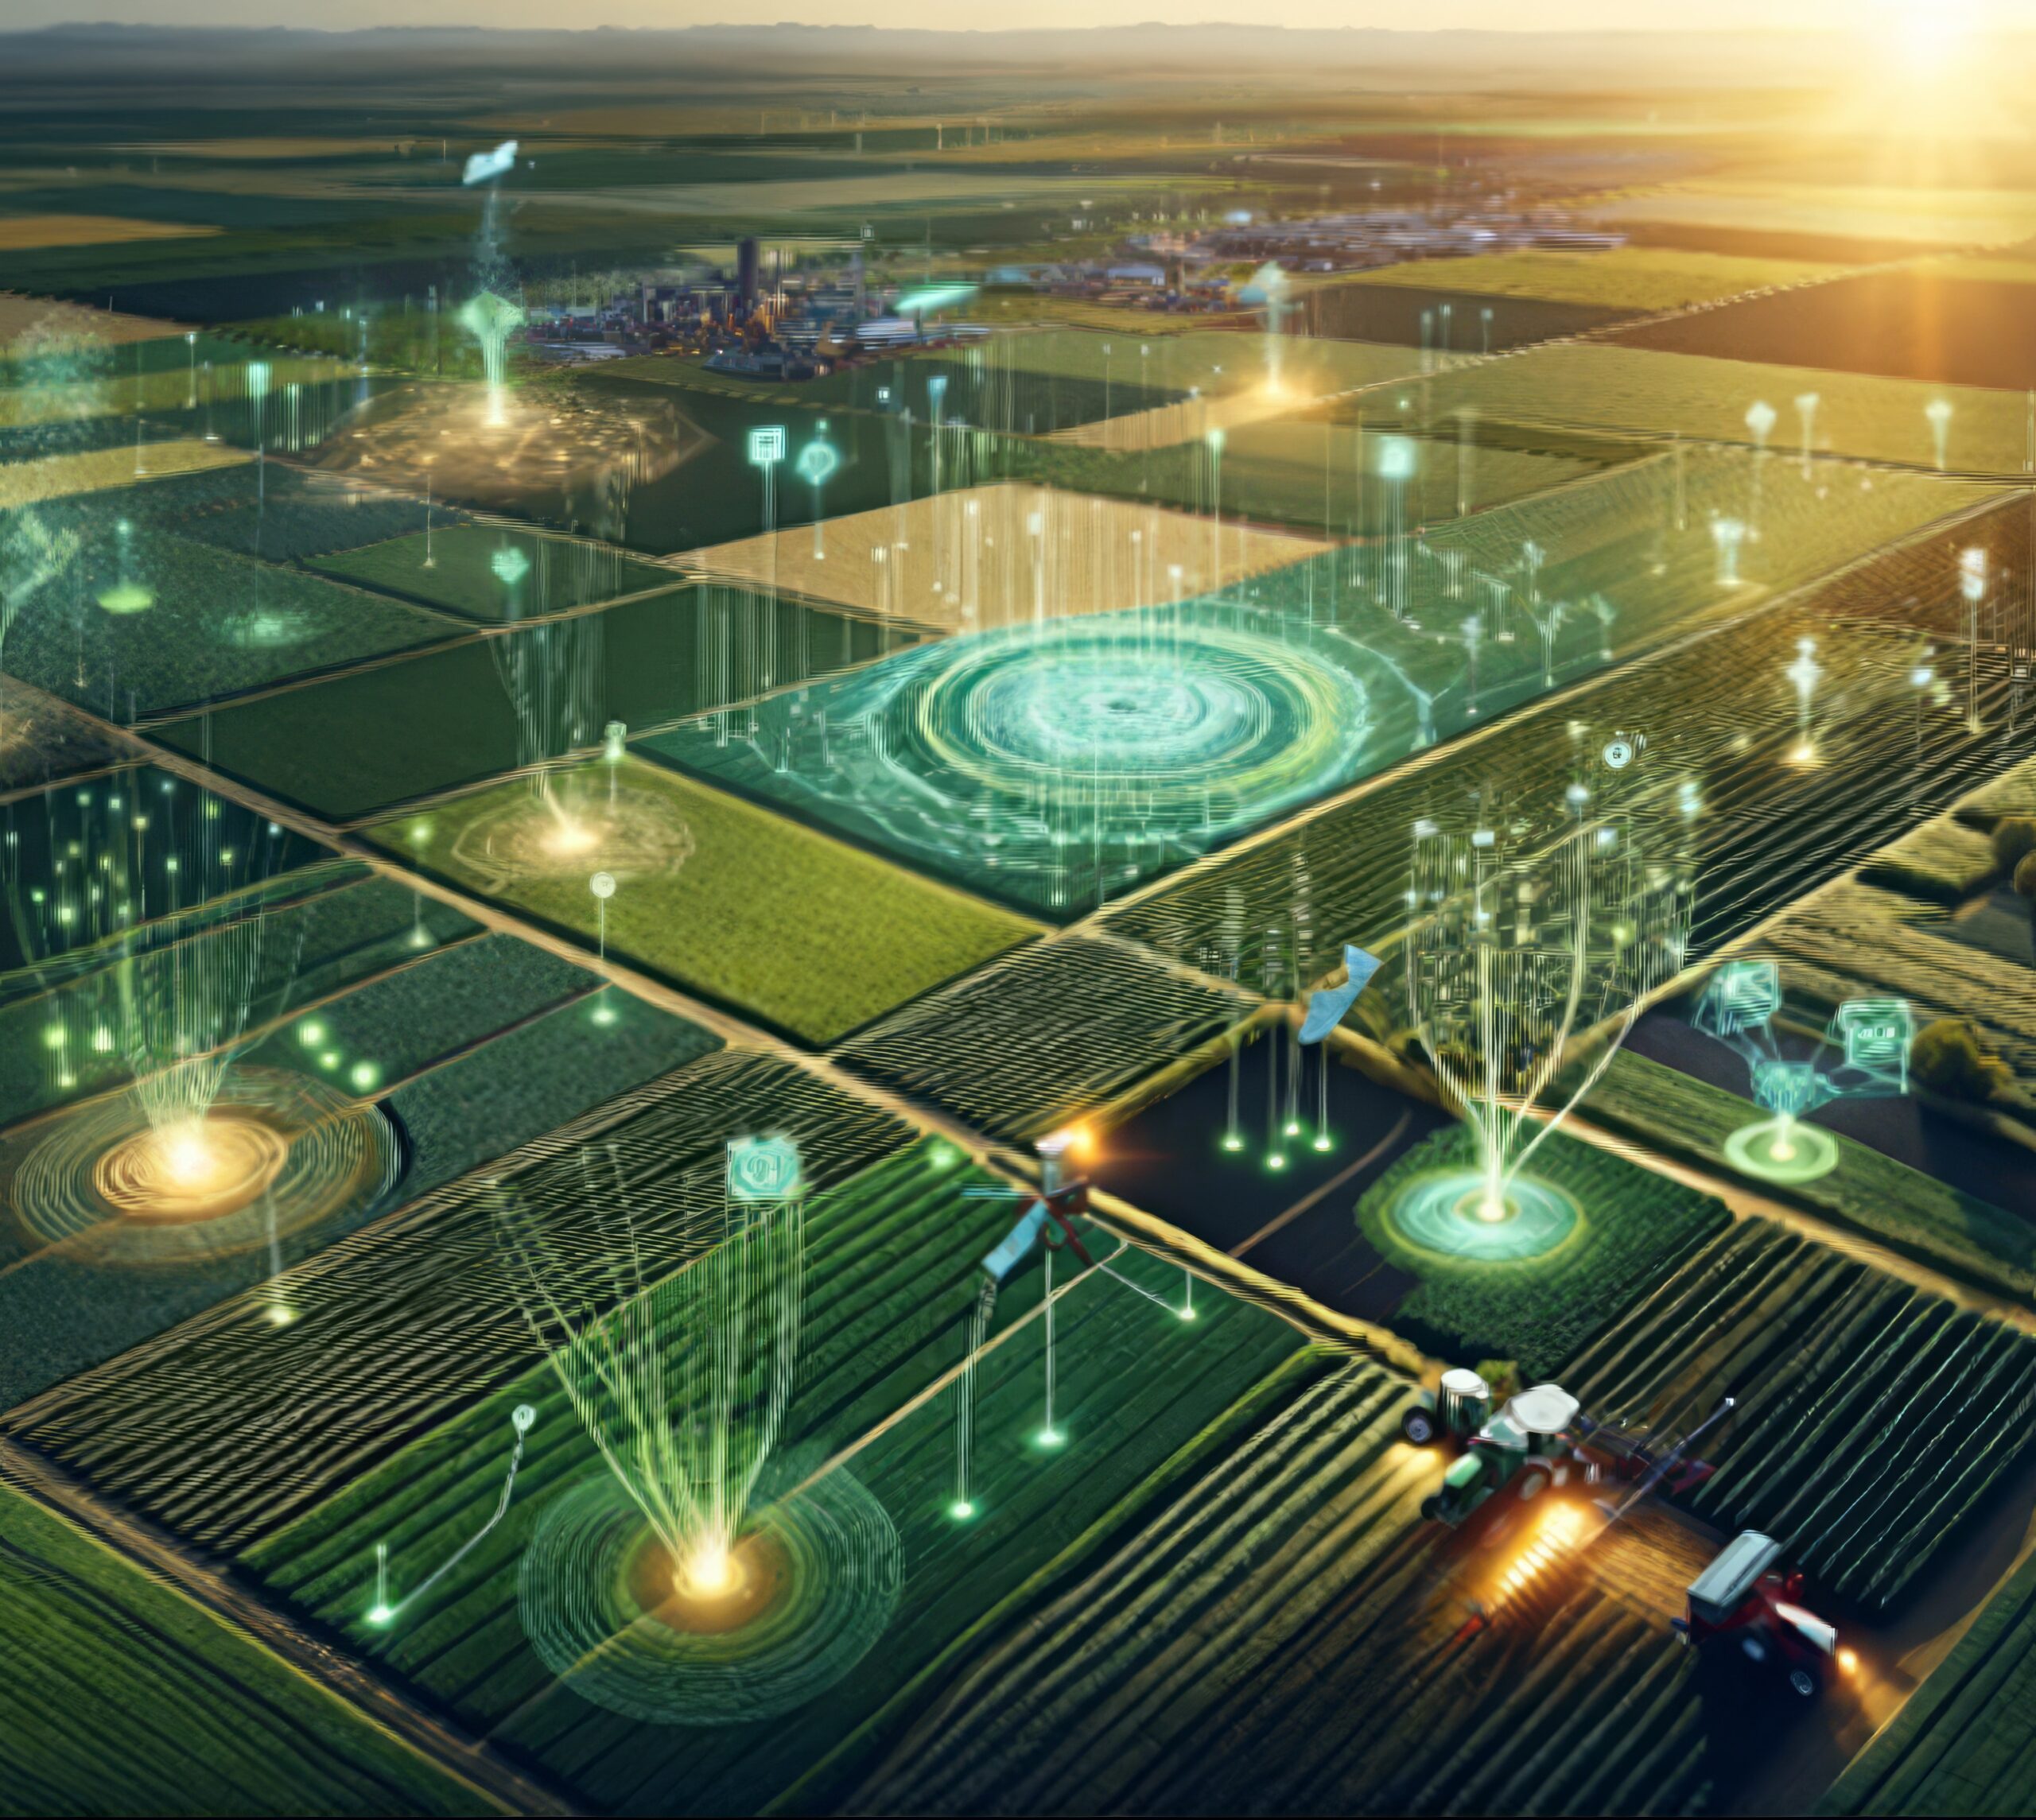
Data-driven insights, combined with precision-enabled equipment, allow for the accurate application of crop inputs
Supported by precision farming advancements, these data-driven insights, combined with precision-enabled equipment, allow for the accurate application of crop inputs, thereby improving efficiency, reducing waste, and minimising environmental impact, all while optimising crop growth..
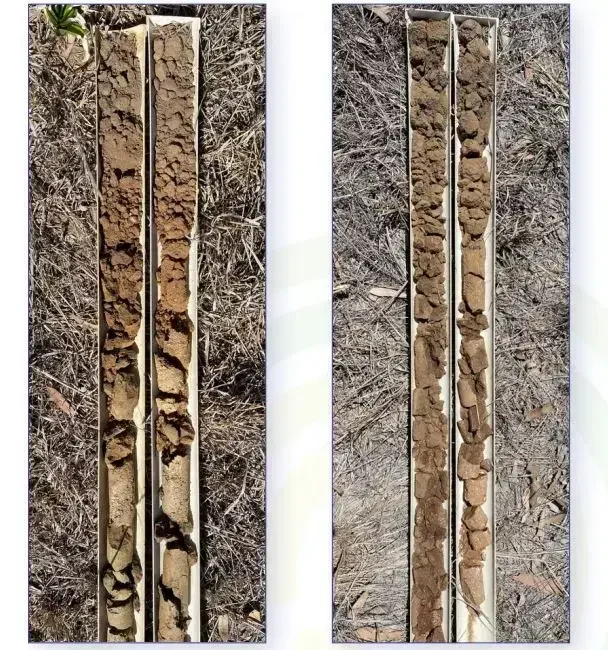
Soil sampling remains a cornerstone of agronomic evaluation, shedding light on critical soil characteristics that might limit farm output, like nutrient shortfalls, pH discrepancies, and moisture issues. By utilising targeted samples, can also ne used in predictive models to spread the valuable point information across entire fields.
Yet, the challenge lies in gathering data that truly reflects the diverse conditions within your fields, a process that can be costly if not approached with a strategic mindset.
It's all about smart sampling—pinpointing the most telling spots in your fields to ensure your efforts and investments yield the most beneficial insights into your soil's health and productivity potential.
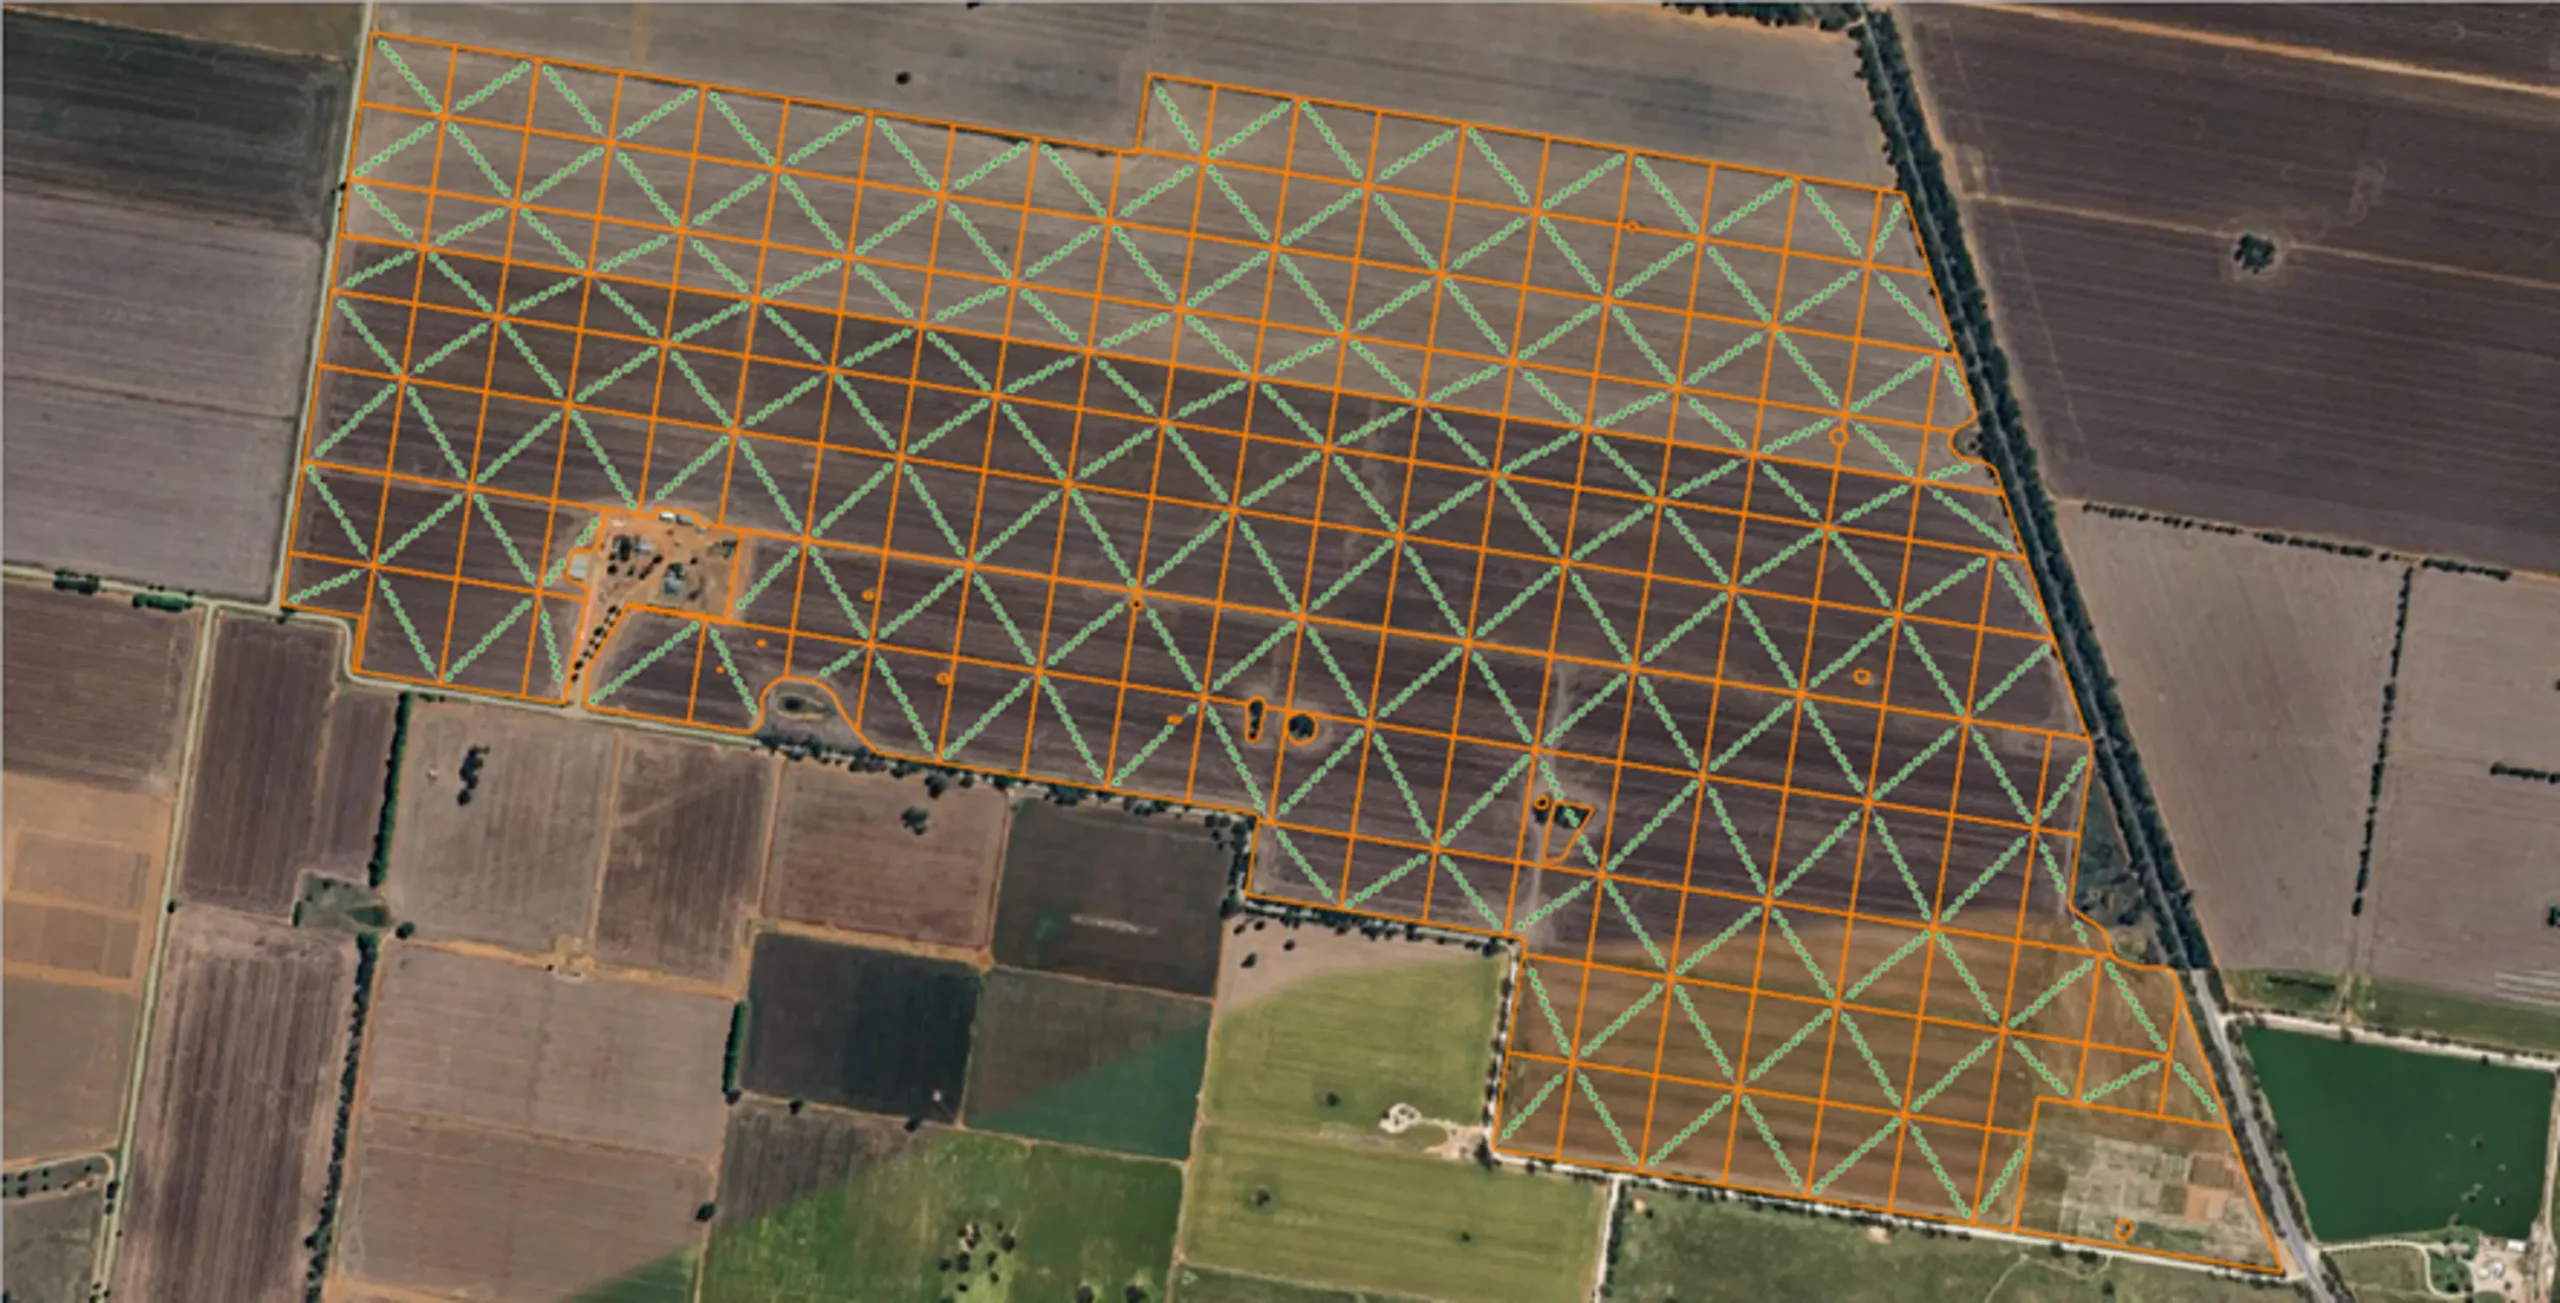
Grid-based soil sampling offers a structured method for examining soil, breaking down a paddock into a consistent grid pattern where a defined number of samples are taken within each grid.
This approach improves the detail in soil data, providing a clearer picture of soil variation and allowing for the creation of management zones suited to particular soil characteristics.
However, this method isn't without its drawbacks; it can be more expensive and requires significant labour compared to more targeted sampling techniques.
This higher cost can lead to fewer samples being collected by increasing grid sizes, which might result in the data not fully representing the soil's inherent diversity, potentially missing out on the full spectrum of soil types and their chemical properties within a paddock.
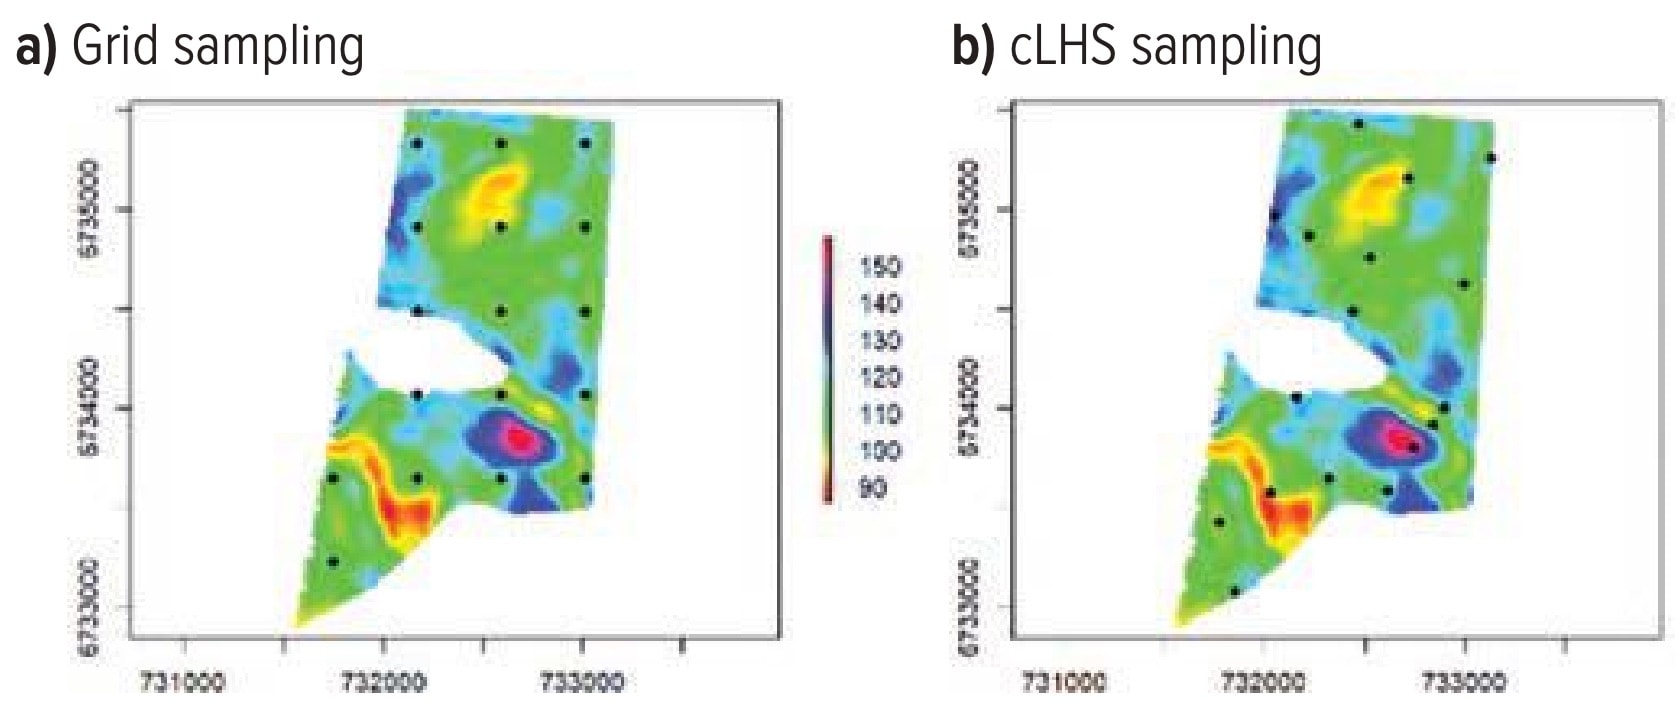
Moving beyond grid sampling, a targeted approach involves leveraging existing farm data to strategically pinpoint sampling sites within designated management zones, thus tailoring a more focused and efficient soil sampling regimen. This method can incorporate data from proximal sensing techniques, yield maps, or satellite imagery to reveal soil and yield variability. Such insights enable the identification of the most strategic points for sample collection, enhancing cost-effectiveness and deepening understanding of soil variation across paddocks.
Additionally, employing strategies like conditioned Latin hypercube sampling (cLHS) brings an advanced statistical edge to optimising sample site selection. This approach ensures a representative spread across available spatial datasets to capture the soil's spatial variability with fewer samples. By integrating these data-driven strategies, growers can achieve a more nuanced and cost-effective understanding of their soil's health and productivity potential.
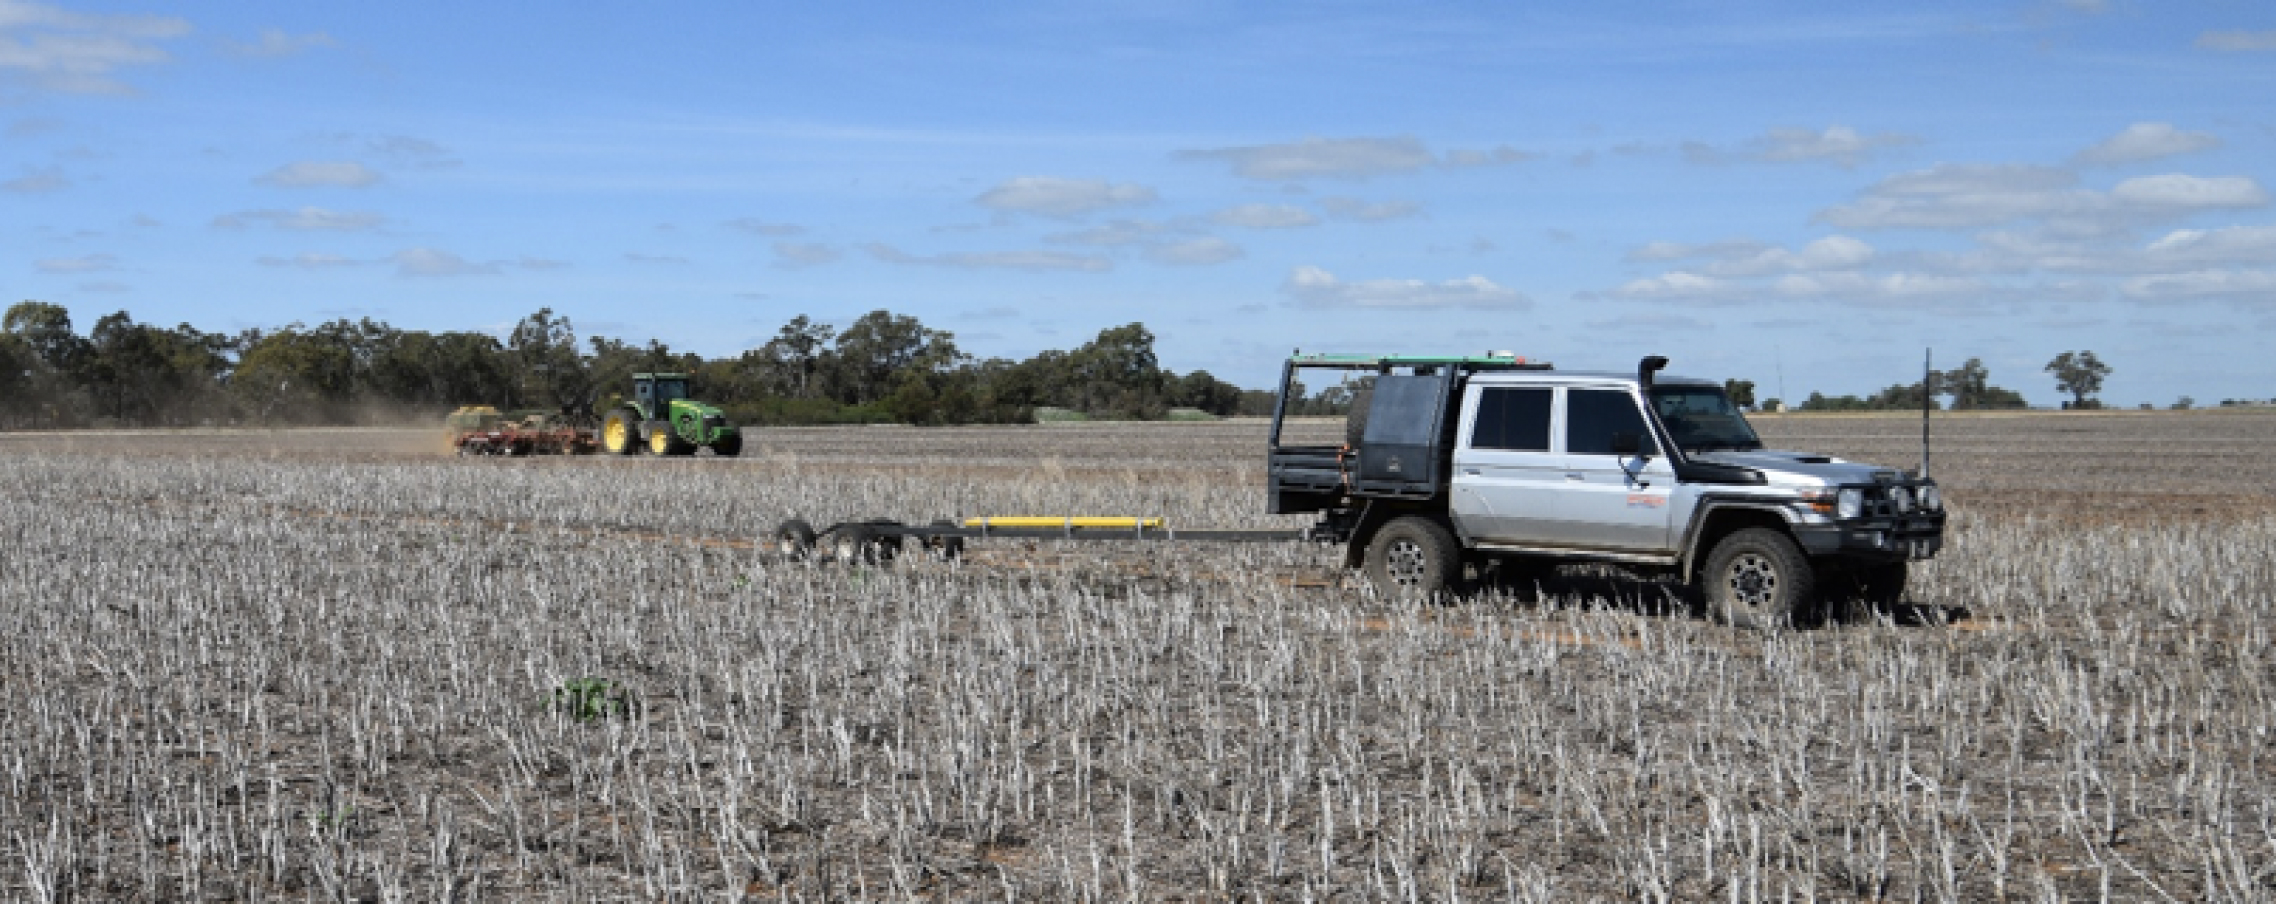
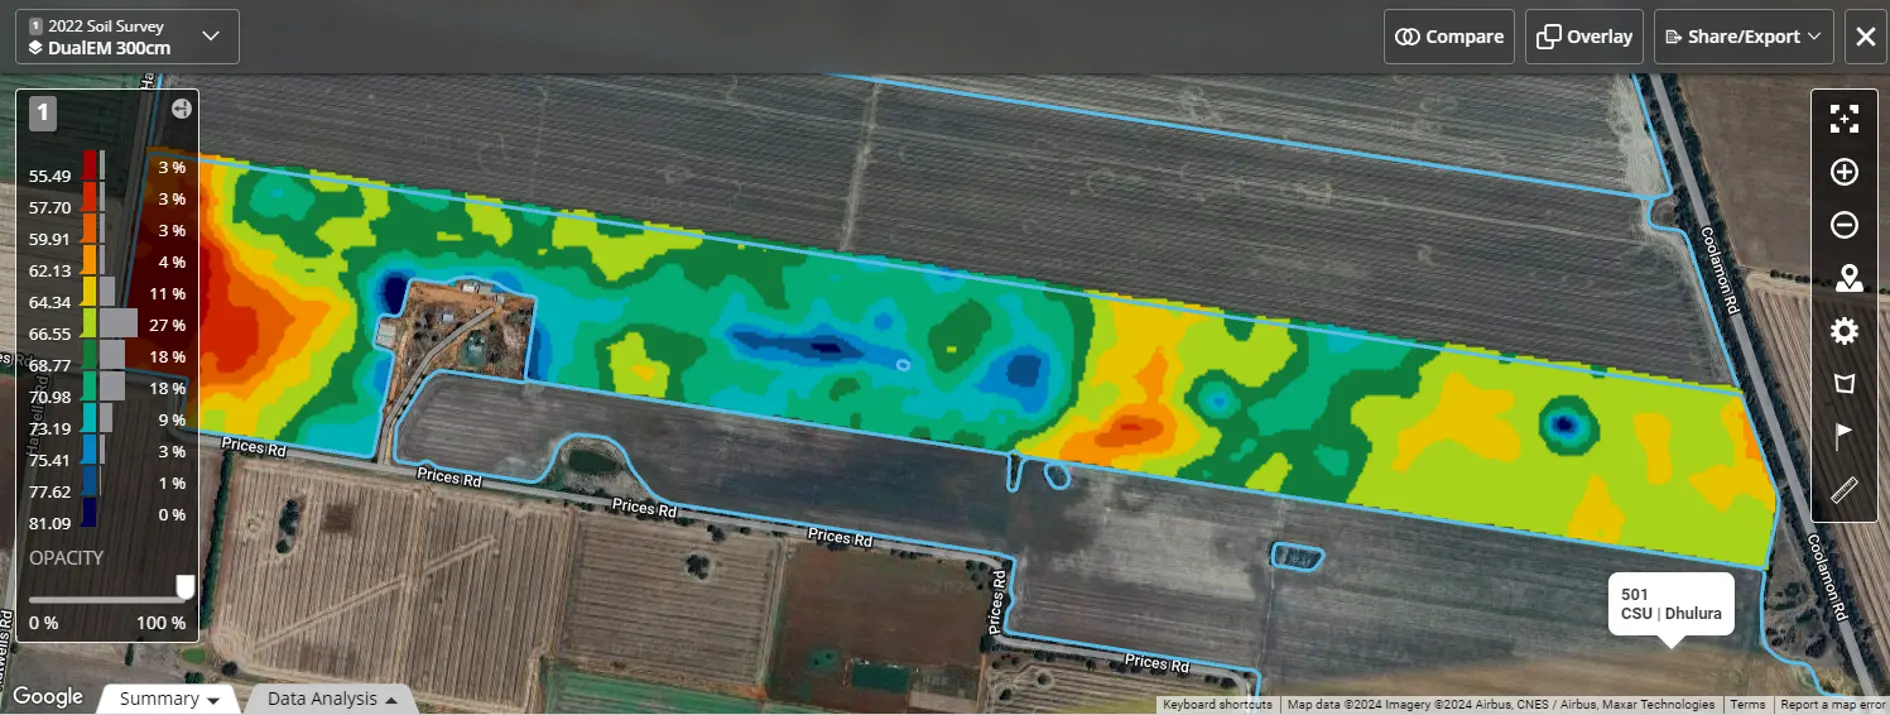
Electro-magnetic induction (EM) proximal sensing has emerged as a cornerstone in the field of Digital Soil Mapping and precision agriculture, providing invaluable insights into soil properties through the measurement of apparent electrical conductivity (EC) at various depths.
EM sensors, operate by transmitting an electromagnetic pulse into the soil and measuring the resultant interference, offering a non-invasive means to gauge soil EC. Soil EC is an indirect measure of salinity, but also indicative of soil texture and moisture. Higher Soil EC readings are typically associated with clay-rich soils that exhibit greater moisture and salt content.
Conversely, sandy soils, which are less dense, tend to show lower conductivity readings, with measurements largely affected by soil moisture and the depth to underlying clay layers.
EM sensors, operate by transmitting an electromagnetic pulse into the soil.
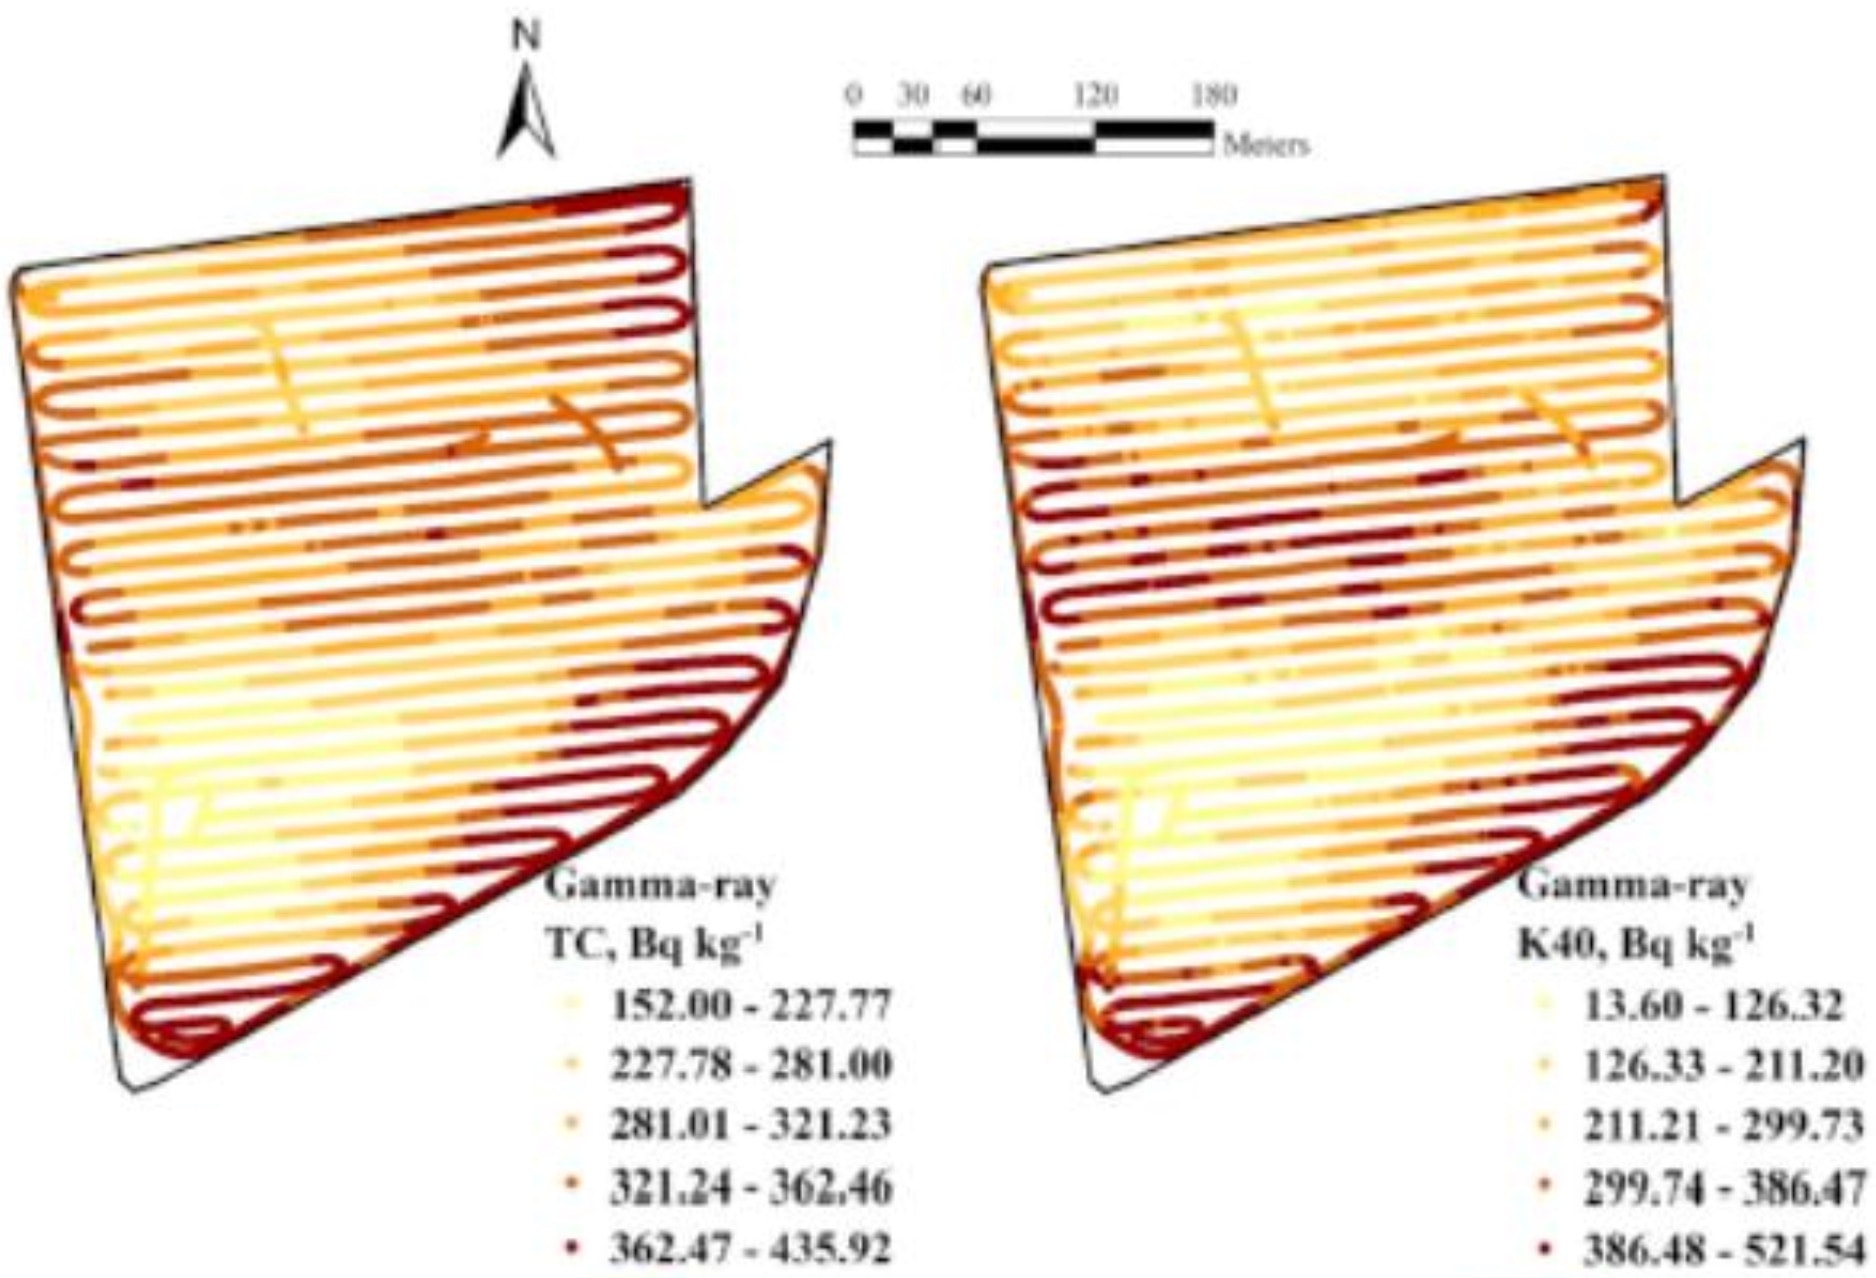
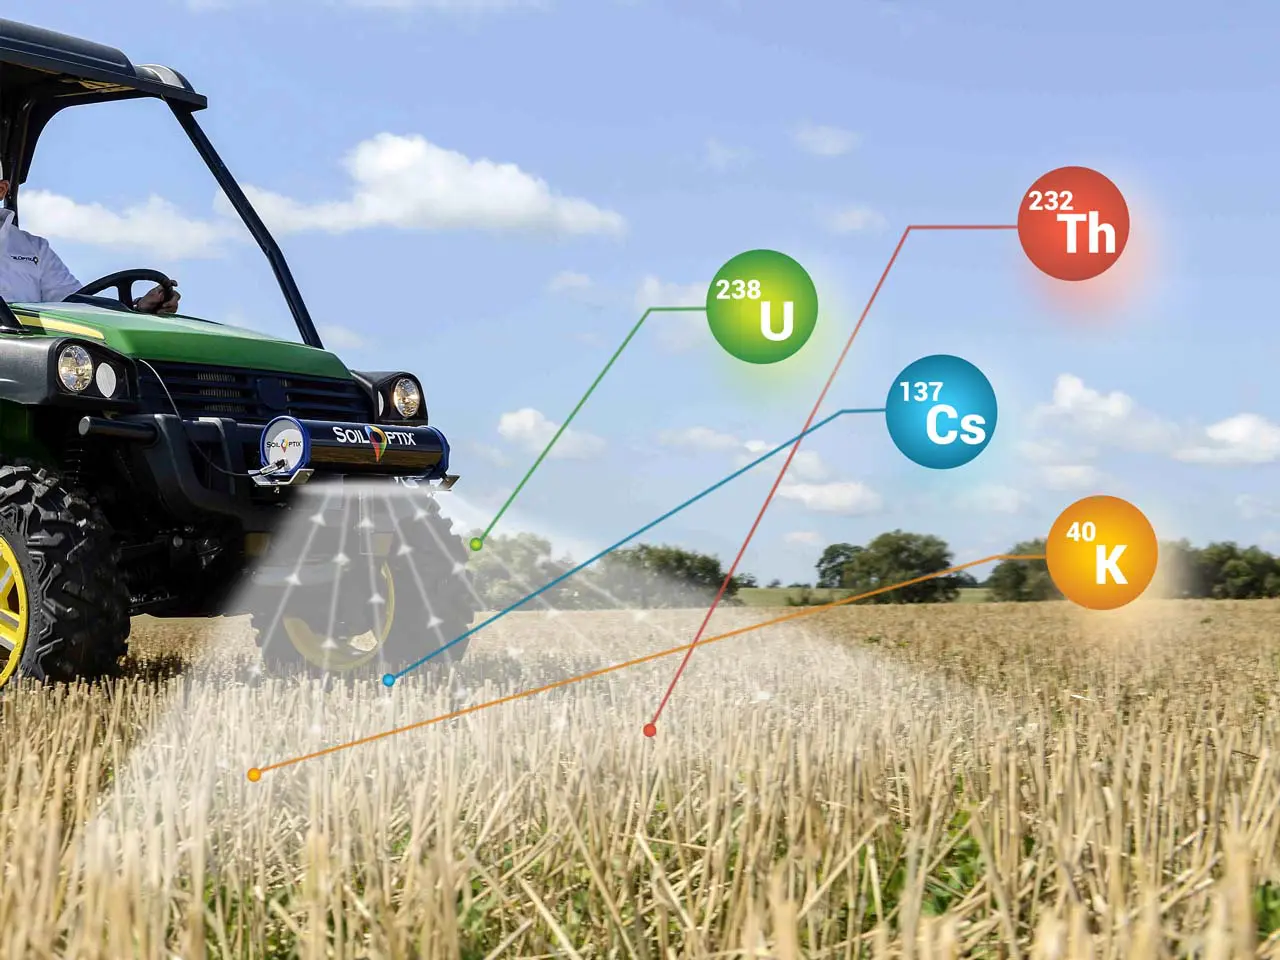
Gamma Radiometric can help to differentiate bedrock and soil, detect weathering intensity, textural properties, and soil nutrient status. This soil survey method is particularly useful in sandy and sandy gravel soil, common to Western Australia, which often yields low EM readings despite the presence of soil type variations.
Due to the nature of the survey, where the effectiveness of radiometric signals diminishes with depth, this survey is reliable only up to 40cm.
The Gamma Radiometric sensing unit is mounted approximately 80cm above the ground. Surveying with this unit requires a narrower recommended swath width, 12m, relating to a 24Ha capacity at speeds of 20kph.
Gamma radiometric surveys are particularly useful in sandy and sandy gravel soil, common to Western Australia
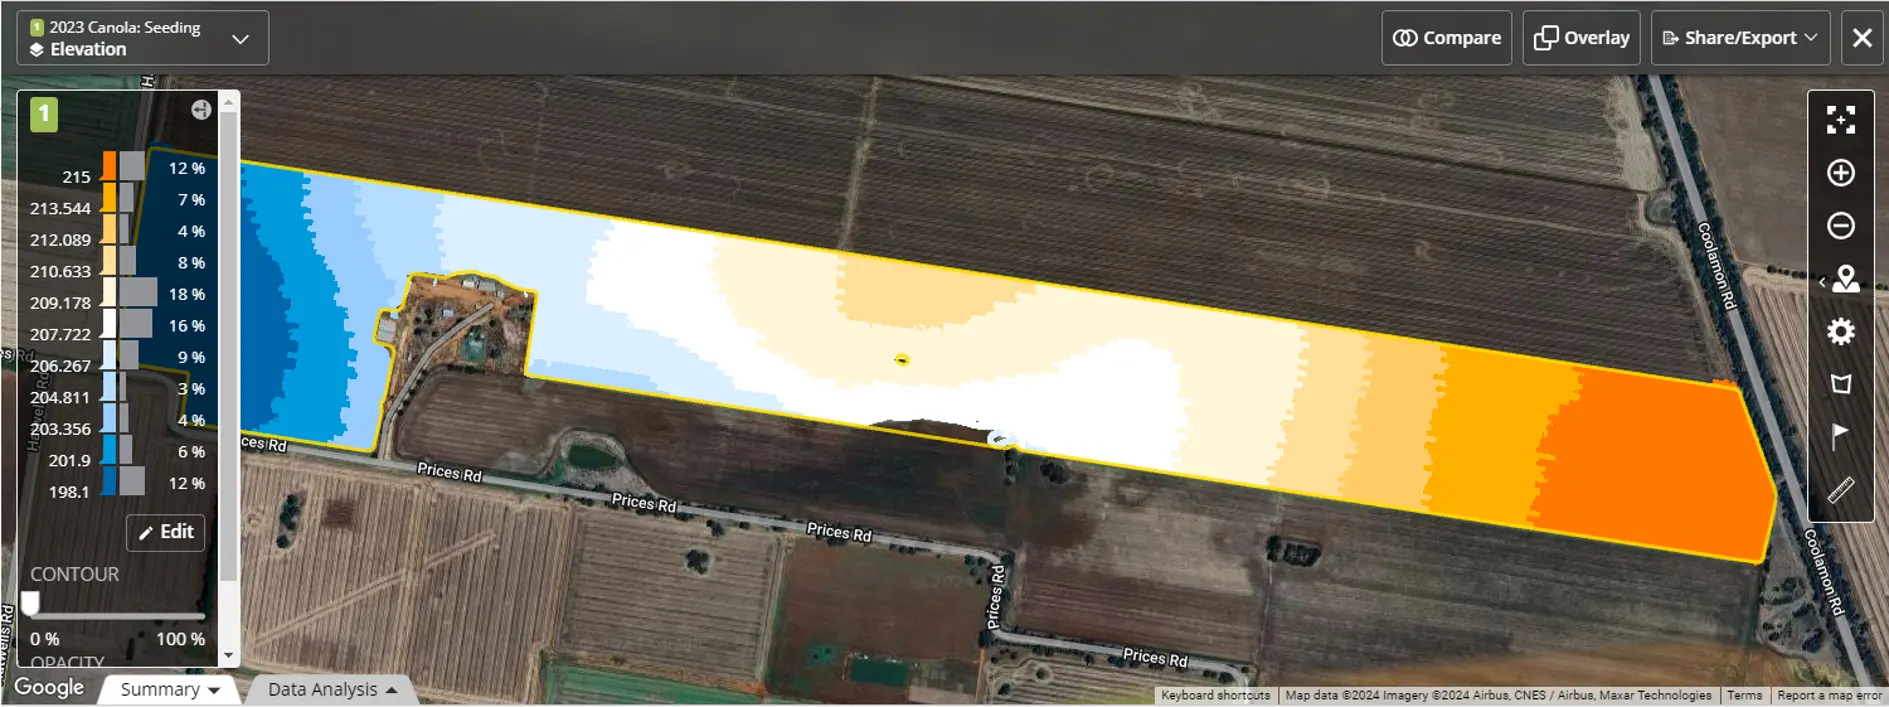
Utilising elevation data alongside spatial soil assessments greatly improves the insight into paddock topography, essential for precision agriculture in Australia. Although free regional elevation datasets are available across many states, their resolution might not meet the needs for in-depth paddock analysis.
Elevation information gathered during planting, or in conjunction with other proximal sensing activities, tends to be more accurate and is readily accessible via machinery consoles or through comprehensive farm management platforms like the John Deere Operations Centre or AFS Connect. It's important to note, though, that elevation data collected during harvesting or spraying may not be as dependable due to the variability in machinery weight.
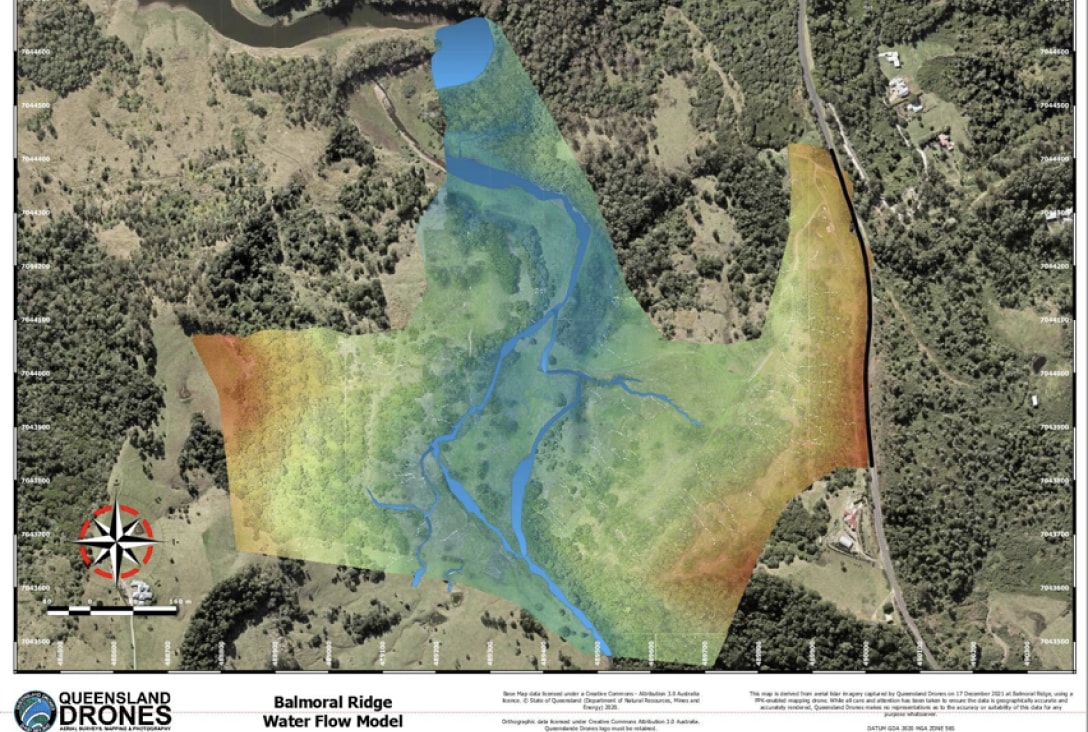
For more detailed elevation and topographical insights, aerial Light Detection and Ranging (LiDAR) technology, though less commonly employed, provides high-resolution 3D paddock mapping by measuring distances with a pulsed laser. This technology is available through contracted services using manned flights or drones.
Year-to-year variations in field yield are often attributed to elevation differences, affecting water transfer and retention across the landscape.
Sloped areas tend to drain water away, while flatter regions are prone to moisture accumulation.
This variability in water storage is also influenced by soil types, each with distinct water-holding capacities. Consequently, yield responses can fluctuate seasonally; lower areas that retain moisture may thrive in dry conditions but suffer in wet seasons due to waterlogging.
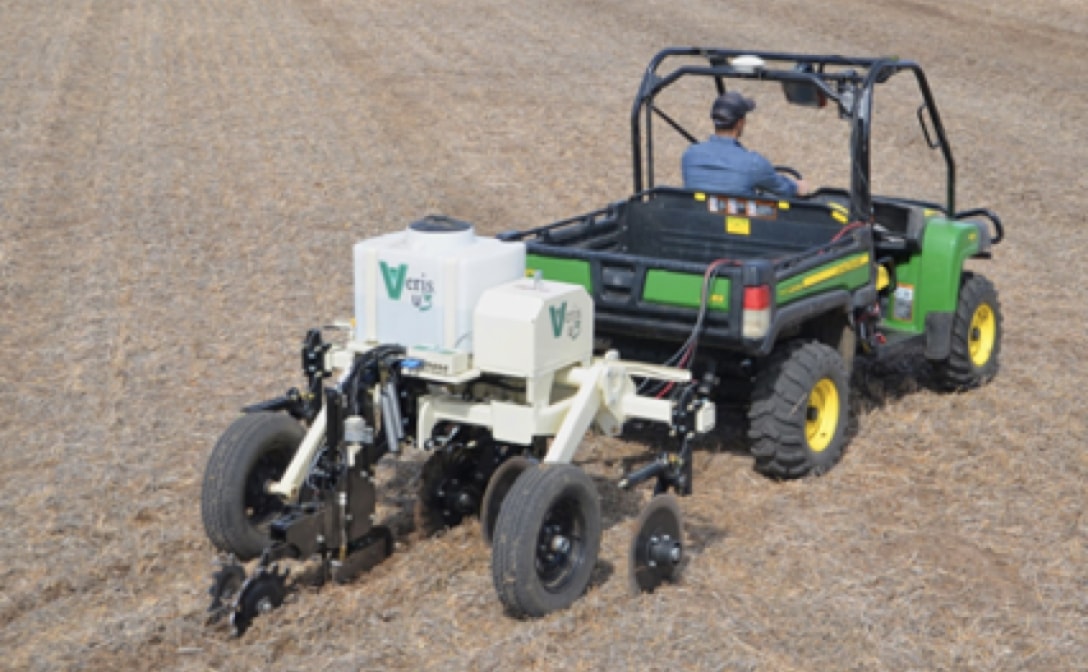
This advanced system integrates a hydraulic soil sampler, pH electrode measurement technology, and a water wash feature.
In operation, an ion-selective electrode penetrates the soil to approximately 10 centimetres deep, obtaining pH readings.
It utilises the soil's inherent moisture for accurate pH assessments, with calibration against known standards ensuring precision.
After each measurement, the sampled soil is ejected, and the electrodes are promptly cleaned with a water jet, readying the system for continuous use.
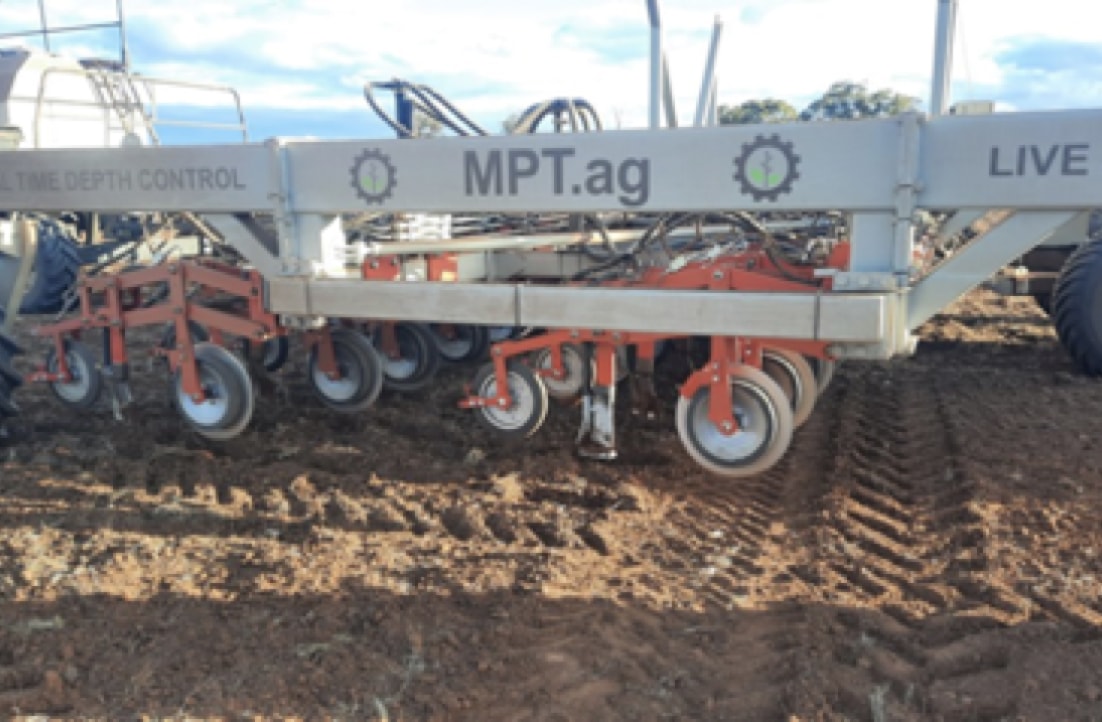
This advanced soil mapping and furrow sensing tool provides accurate data on EC, soil organic carbon (SOC), moisture, and temperature, reaching depths of up to 60 centimetres.
Equipped with its own GPS receiver, the iScan wirelessly relays information to a tablet PC inside the cabin, with just a 12V power supply needed for activation.
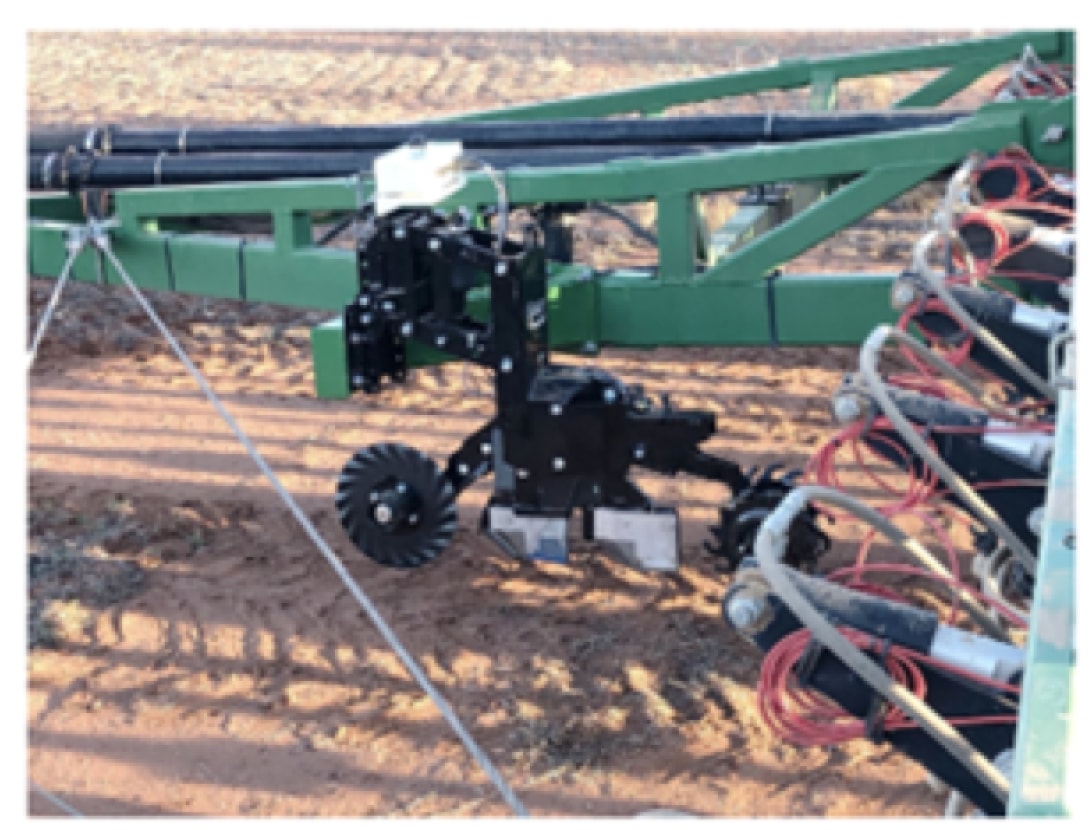
The system is designed for real-time data utilisation, where the Smart Seeder adjusts seeding depth on the go based on soil moisture, shown to reduce fuel usage.
Additionally, the data collected can be integrated with existing field maps, enriching the farmer's understanding of paddock variability. This, in turn, supports more precise zoning for targeted soil sampling, optimising farm management practices.
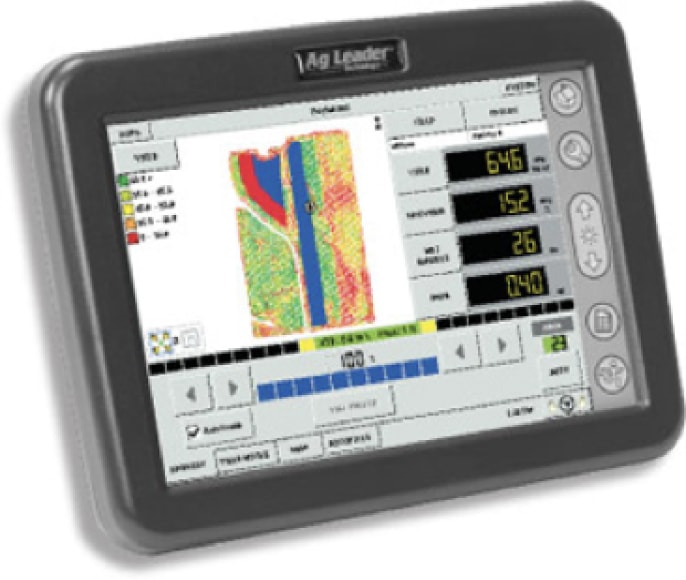
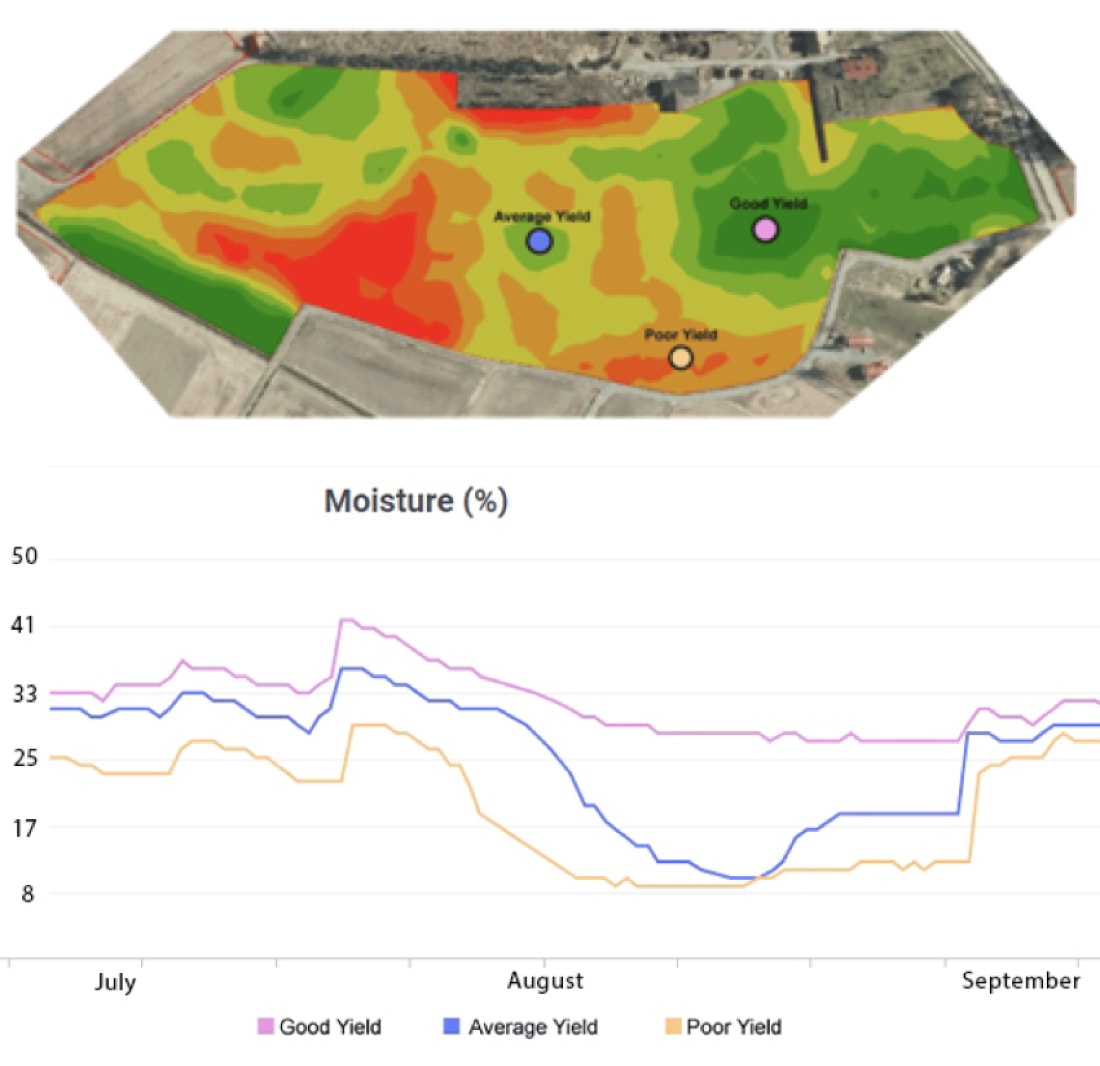
Yield data, collected by the combine at harvest, serves as a crucial indicator of the variability of crop production within a field.
Yield maps often highlight zones with varying plant available water content, correlating with higher and lower yields. However, this variation may also be driven by other yield-determining factors, such as disease, soil compaction, or salinity, which impact water uptake.
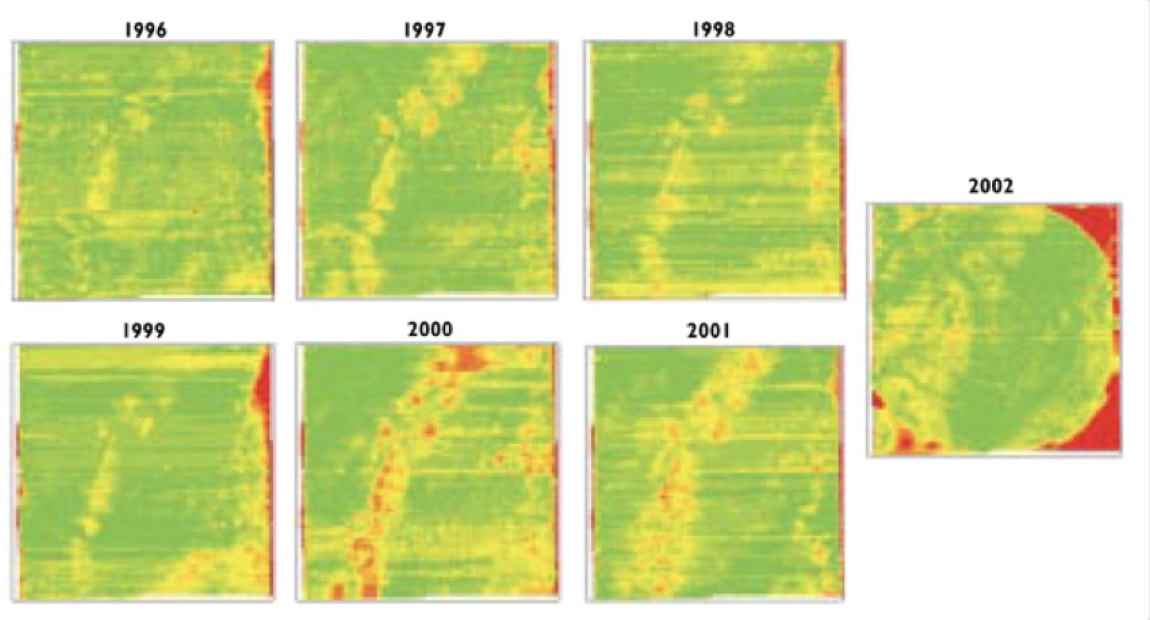
In the Riverina, the primary factors influencing yield can shift from season to season with changing growing conditions. This is particularly true where climatic conditions may drive higher levels of waterlogging, pest damage, or weed issues. To overcome changes in field variability, a multi-year analysis of yield data can be used to provide a more accurate classification of paddock zones based on consistent yield performance—high, average, below-average, or variable.
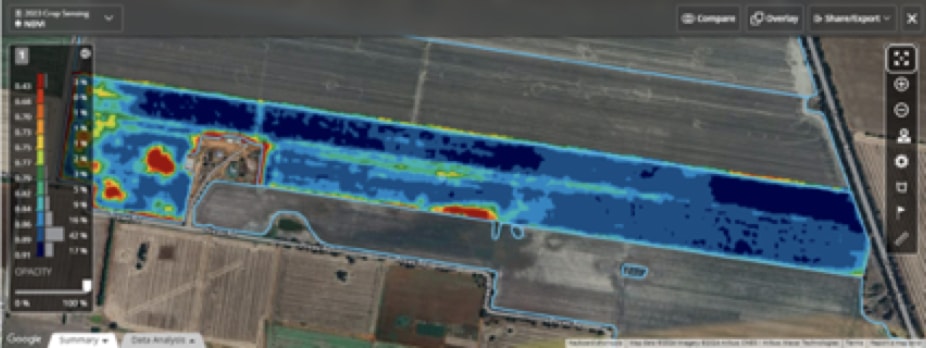
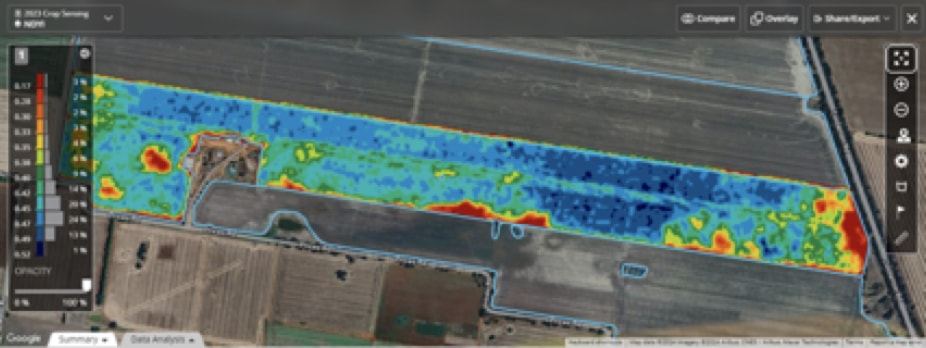
Airborne imagery from satellites, manned aircraft, and drones offers an aerial view of landscapes and crops. These visuals are key for spotting crop variability at different growth stages, which often can’t be detected with ground-level observations.
Common remotely sensed vegetation indices are listed below:
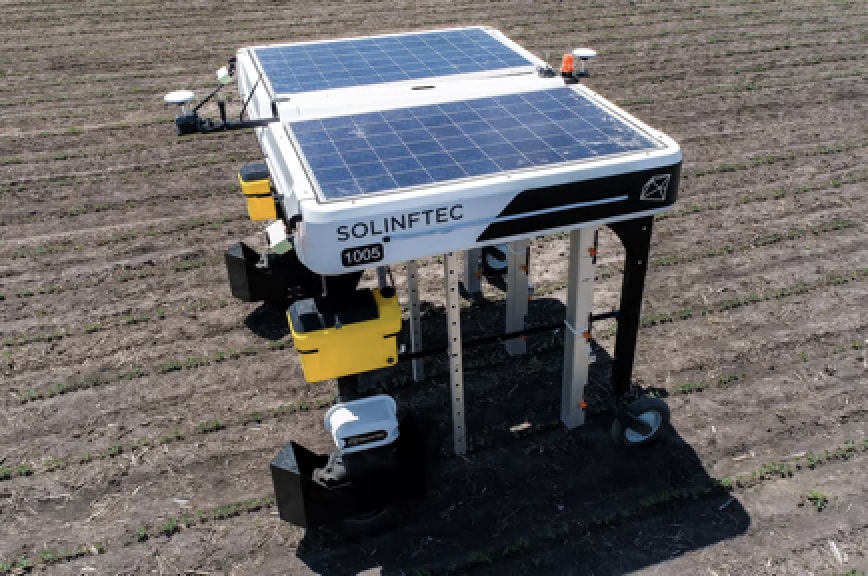
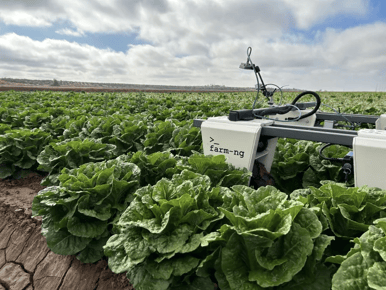
The evolution of GPS-enabled automated agricultural robotics have the potential to significantly improve sensing and collection of proximal and crop growth data used in precision agriculture.
These robots, equipped with GPS for precise navigation, can autonomously roam fields, gathering detailed data on soil properties and crop health indicators at higher frequency and resolution. The ability to conduct frequent and thorough data collection with these robots reduces the reliance on manual labour, streamlining operations and cutting costs.
As a result, farmers and agronomists can focus on strategic decision-making and management, leverage the detailed insights provided by robotic technology to optimise crop yields and resource use.
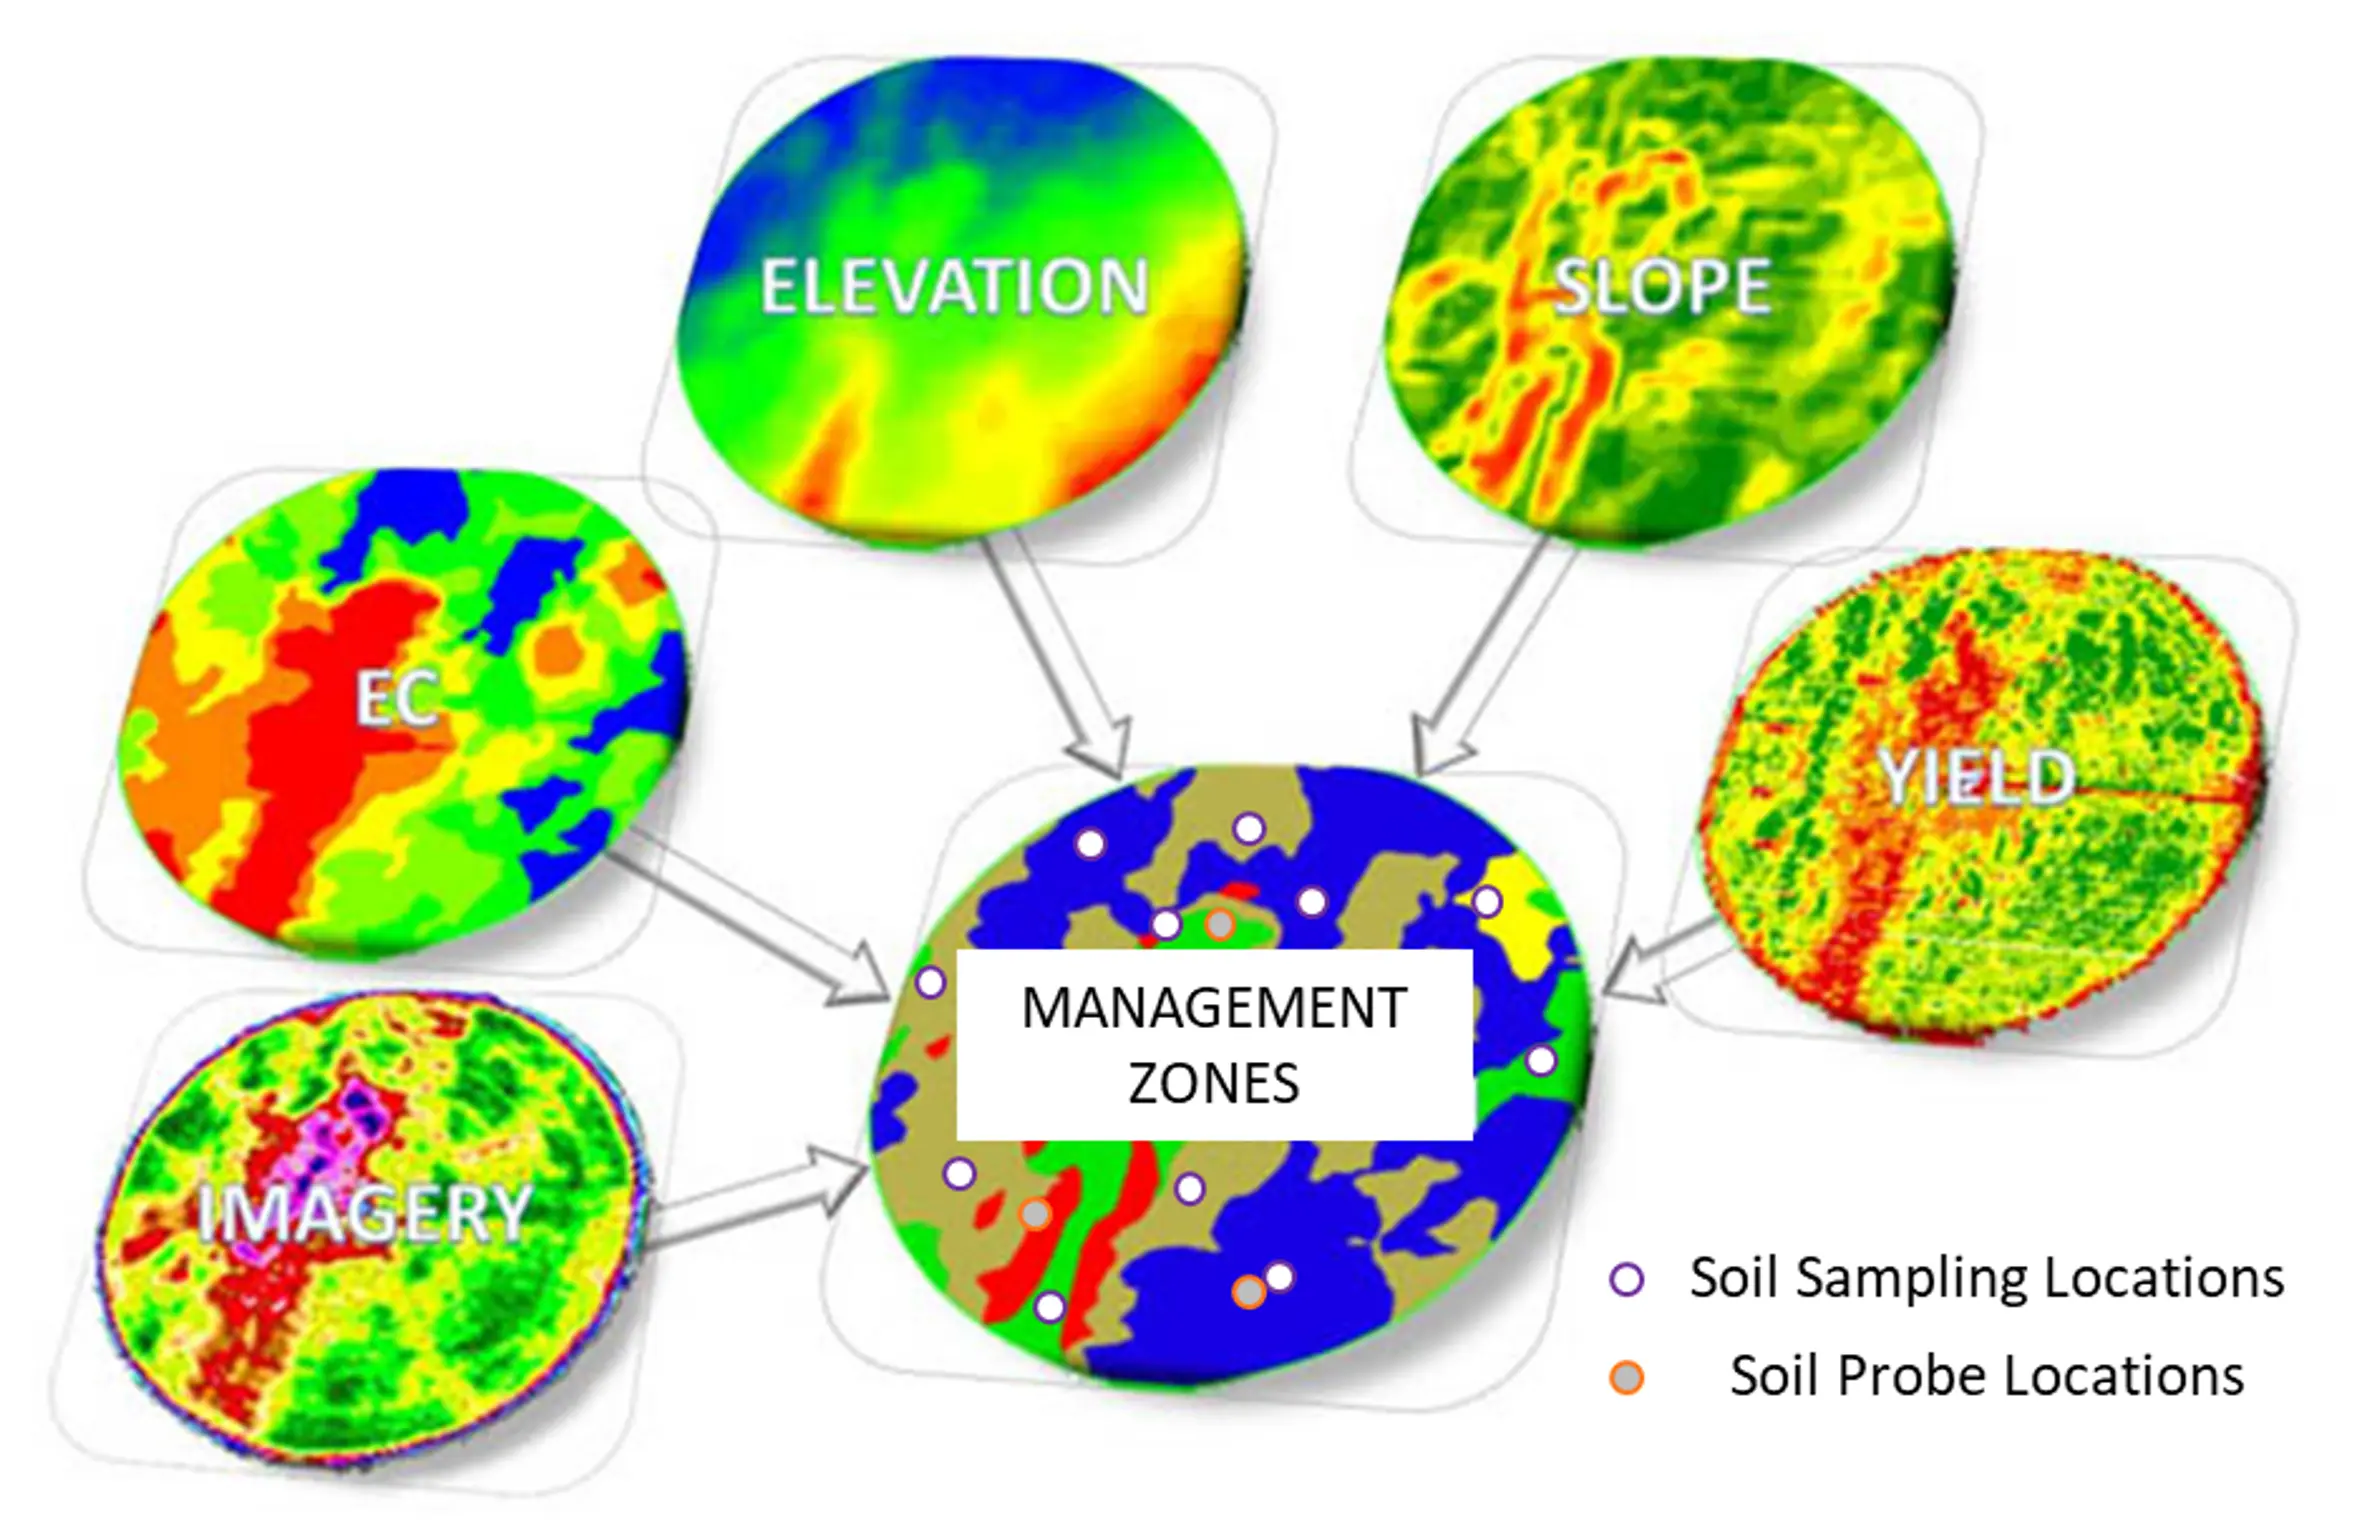
Stacking multiple proximal and spatial data layers is an efficient method for defining informed management zones across your paddocks. These stacked layers and subsequent management zones can then be used to inform the most efficient soil sampling locations to best capture the variability of the paddock.
By employing a statistical clustering technique, paddocks can be divided into zones with similar characteristics based on the data layers. The number of zones can be data-driven or based on a grower assessment of paddock variability.
Soil sample distribution within each zone is then tailored to reflect the zone's proportion of the paddock area, ensuring a sampling strategy that truly represents each zone's conditions. Selection of precise sampling points within zones aims for geographical balance and accounts for variability within zones, through either random or strategic selection.
Gamma radiometric surveys are particularly useful in sandy and sandy gravel soil, common to Western Australia
Following soil sampling, the analysis of soil properties can confirm the existence of distinct management zones, enabling the formulation of tailored crop management strategies that align input applications with the productive capacity of each zone.
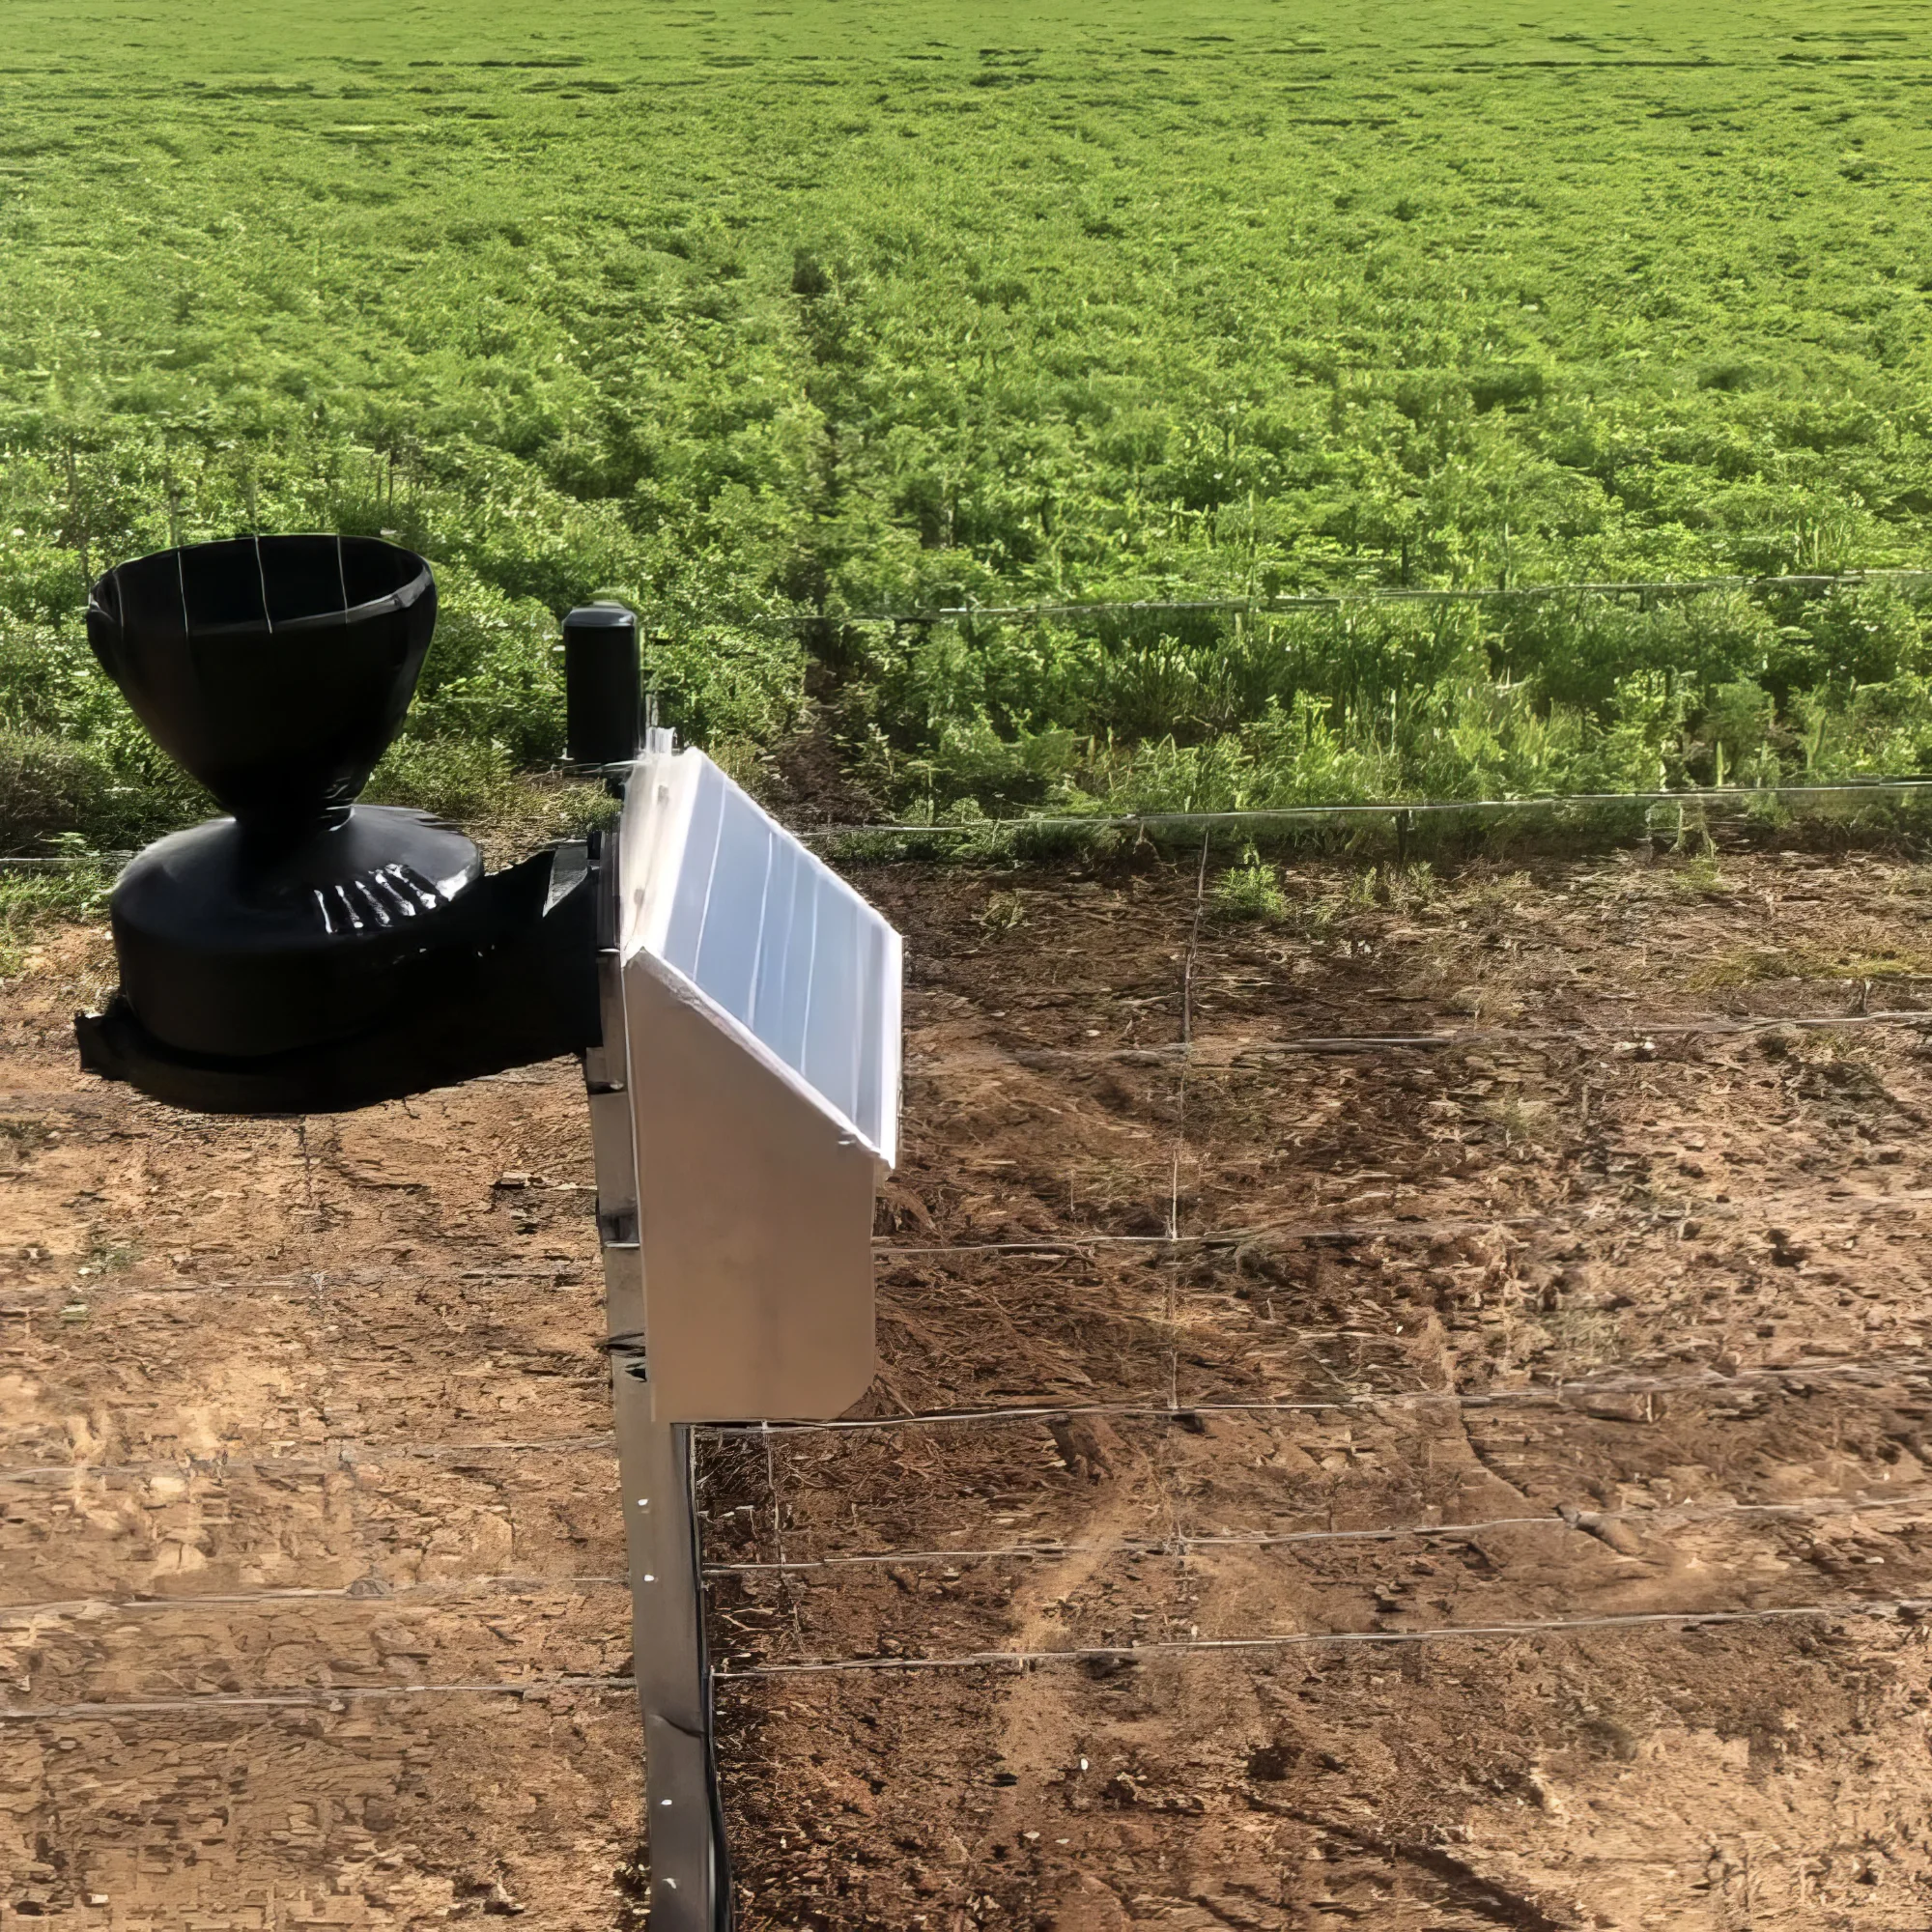
Moreover, the delineation of these zones and the selected sampling locations can inform the strategic positioning of fixed soil monitoring systems, such as moisture and EC sensors. These permanent installations provide ongoing insights into soil conditions during the growth season, making their accurate placement within the zones vital to ensure the reliability of the data they generate, thereby supporting effective crop management decisions.
Beyond aiding irrigation, these moisture readings are also beneficial for dryland farming. Tracking soil moisture levels, combined with in-season rainfall forecasts, can improve the ability of farmers and agronomists to forecast their crop yield. This more accurate yield estimation can inform decisions on input investments, like nitrogen. By assessing moisture in the root zones, farmers can adjust nitrogen use to match current conditions, optimising resource deployment. The improved yield estimation can inform grain marketing strategies prior to the start of harvest.
In livestock management, the data gathered from moisture probes play a crucial role in guiding key decisions about grazing strategies, acquiring additional or containment feed, and determining the best times to buy or sell livestock, as well as assessing nitrogen requirements for pasture health.
Such informed decision-making aids in maintaining the sustainability of both soil and pastures by ensuring that minimal feed levels are sustained, promoting healthy regrowth of perennial pastures and supporting the overall ecological balance of the farming system.
Volumetric systems measure the total amount of water in the soil. To estimate how much of this water is “readily available” to plants, the soil type needs to be known.
In practice, volumetric moisture monitoring tools can be used to guide not only when to irrigate but how much water to apply.
Capacitance probes and “total domain reflectometry (TDR)” capacitance spikes are examples of commonly used volumetric monitoring tools.
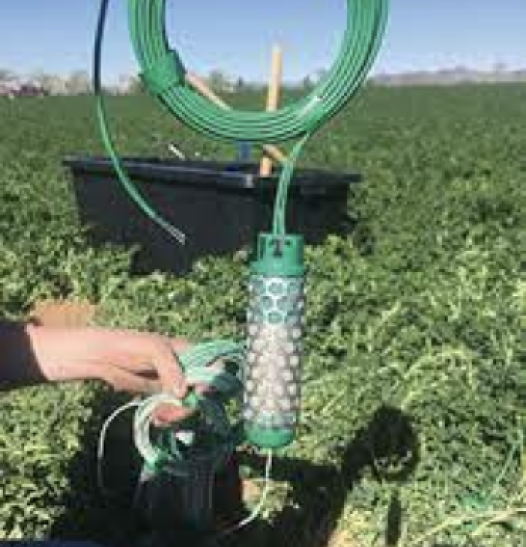
Typically, capacitance probes measure soil moisture at increments (usually 10cm) down the soil profile to a depth of 0.8m to 1.2m.
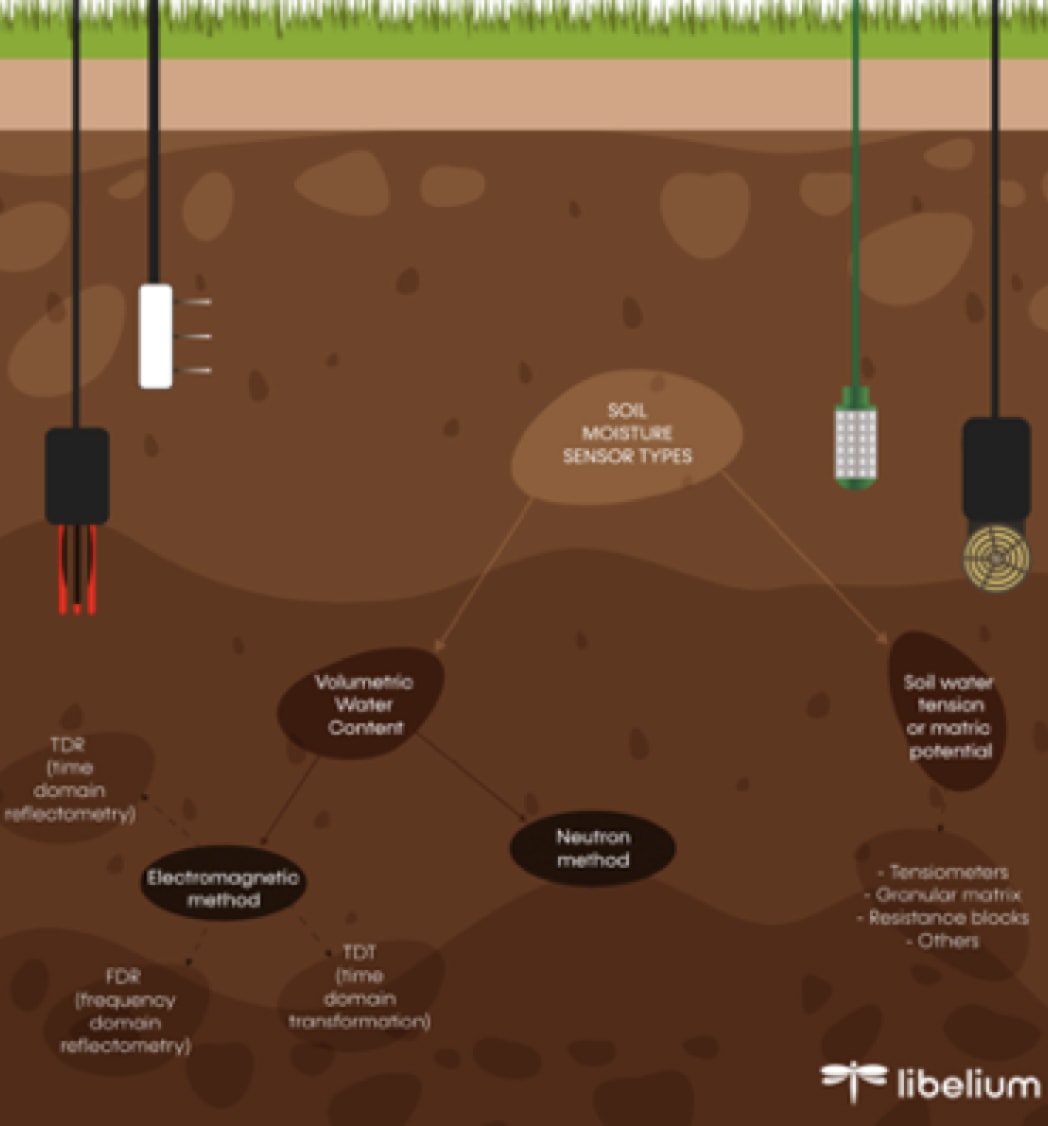
Soil Water Tension Sensors, on the other hand, measure the effort required by plant roots to extract water from the soil, indicating the soil's dryness or saturation level.
Among tension sensors, tensiometers and gypsum blocks are commonly used. Tensiometers directly measure soil moisture suction. The suction reading decreases when the soil around the tensiometer wets up with rain or irrigation.
Conversely, the reading increases as the soil dries out.
Gypsum blocks consist of two electrodes embedded in a block of porous material. As with tensiometers, water is drawn into the block from wetter soil and out of the block from drier soil. The electrical resistance of the block is proportional to its water content, which is related to the soil water suction of the surrounding soil.
Many of the newer soil probes also offer the ability to measure soil temperature and soil EC.
Soil temperature critically influences seed germination and root growth. Hence soil temperature updates from the probe can help farms best match the sowing date to the ideal conditions of the plant. Additionally, the occurrence of numerous soil-related pests and diseases is often linked to temperature. By keeping track of soil temperature, farmers can better forecast potential pest and disease risks, enabling them to take early preventive actions.
Soil electrical conductivity (EC) reflects the salinity levels of the soil, which is pivotal in devising irrigation plans. By merging EC figures with moisture content, farmers can adjust irrigation timetables to counteract salt build-up in areas prone to high salinity, thus averting soil deterioration. Furthermore, EC acts as an indirect gauge of nutrients accessible for plant absorption, assisting in fine-tuning fertiliser application. This approach not only boosts fertilisation efficacy but also prevents excessive use, thereby lessening the environmental impact of farming activities.
Soil moisture probes fall into two categories: Volumetric Soil Moisture sensors and Soil Water Tension Sensors.
When positioning moisture sensors on a farm, it's crucial to consider soil diversity and place sensors in areas that accurately reflect the main soil type, crop growth stage, health, and water usage. It's also essential to ensure sensors are correctly installed and shielded from potential damage by livestock or machinery. For optimal setup, it's recommended to seek advice from experts like manufacturers, retailers, consultants, or irrigation officers.
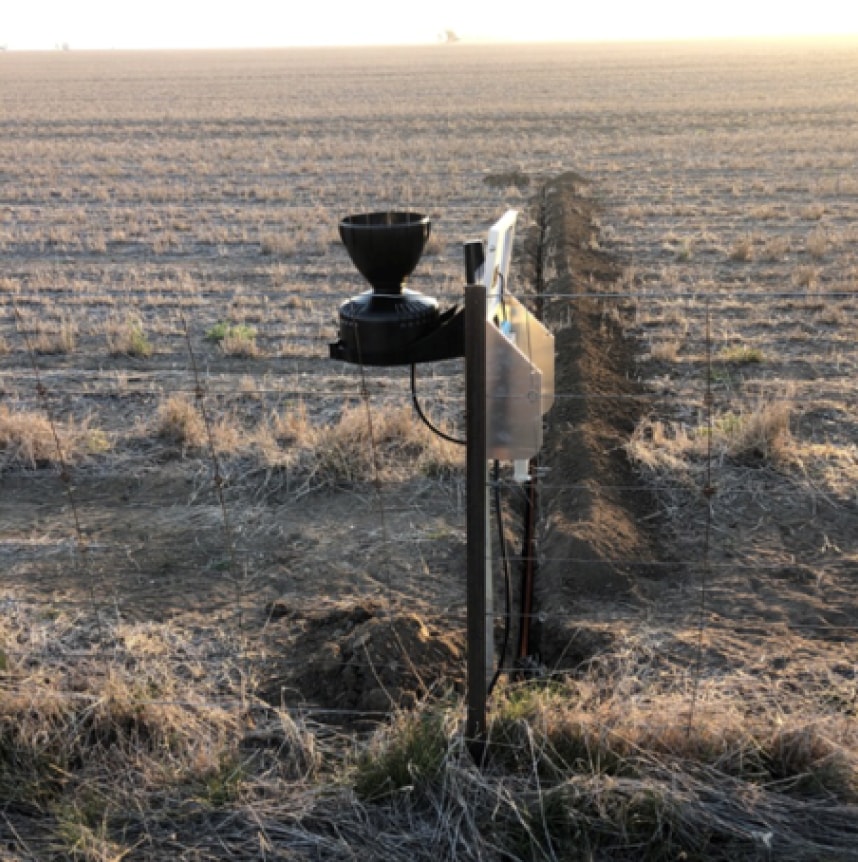
Modern smart soil moisture sensors offer wireless data transmission, flexible deployment options and direct integration with GIS databases, thus removing the need for manual data collection. This data is wirelessly sent to digital devices and displayed in a user-friendly graphical format, facilitating easy data comparison and analysis, accessible from any location with internet connectivity. However, a key factor in choosing the right probe is its connectivity capability, as soil moisture sensors depend on it to transmit data.
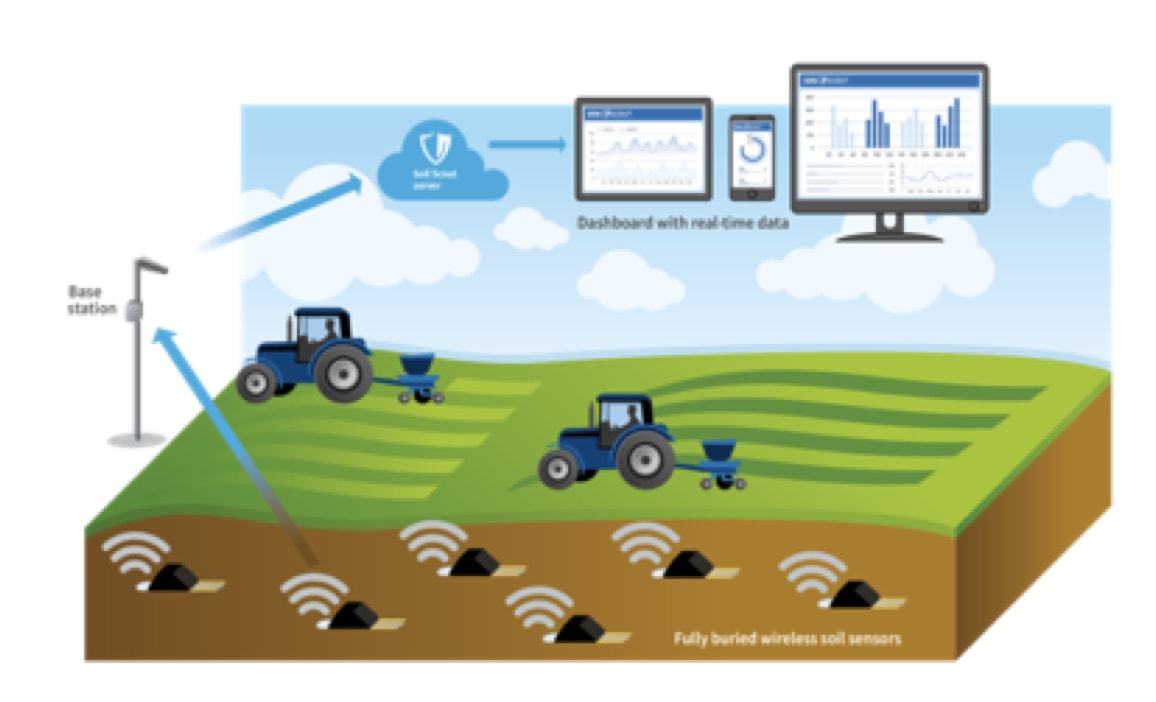
The connectivity landscape is rapidly changing, with various options at different commercialisation stages.
Thorough research or expert consultation is advised to identify the best connectivity solution for your farm, considering that availability and costs may vary by location.
Connectivity options to explore include Mobile, WiFi, LoRaWAN, Low Orbit Satellite, and NarrowBand IoT, each offering different benefits and limitations based on your specific agricultural needs and farm location.
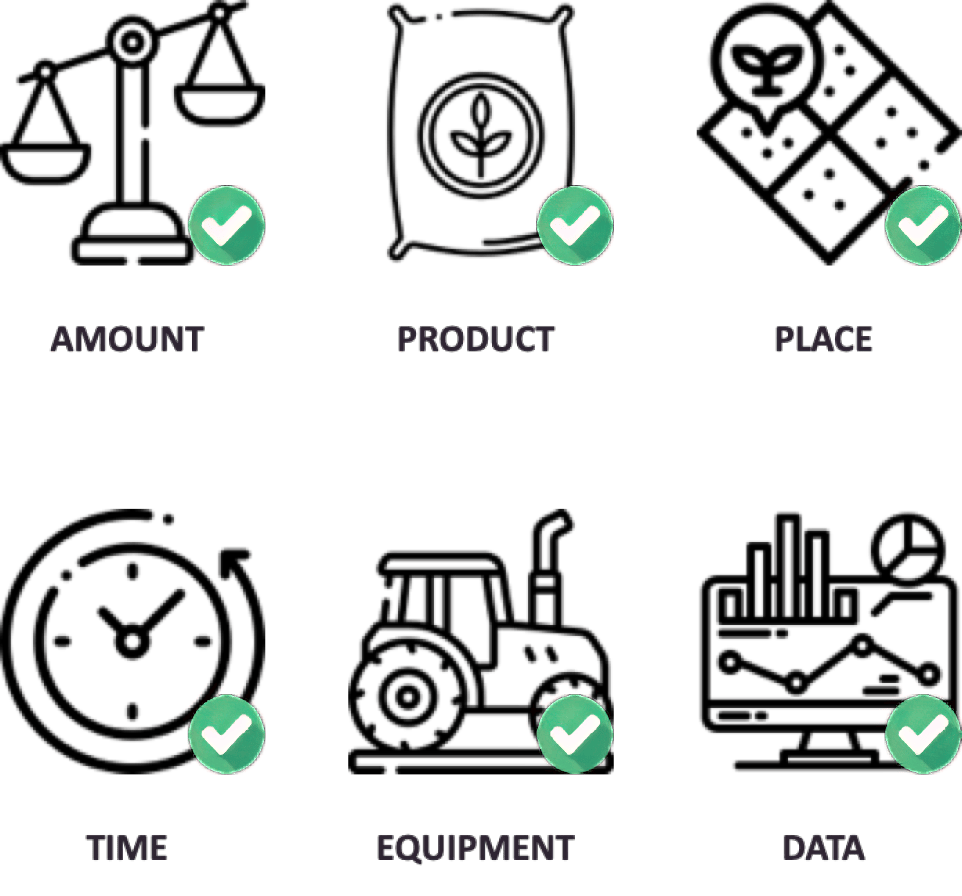
This precision agriculture approach to cropping and pasture management focuses on tailoring farming practices to the unique characteristics of each zone within a field using the 6 Rs. Putting the RIGHT amount of the RIGHT product in the RIGHT place at the RIGHT time (the traditional ‘4 Rs’), using the RIGHT equipment, and making the decision as to the right amount underpinned by the RIGHT data (the ‘6 Rs’).
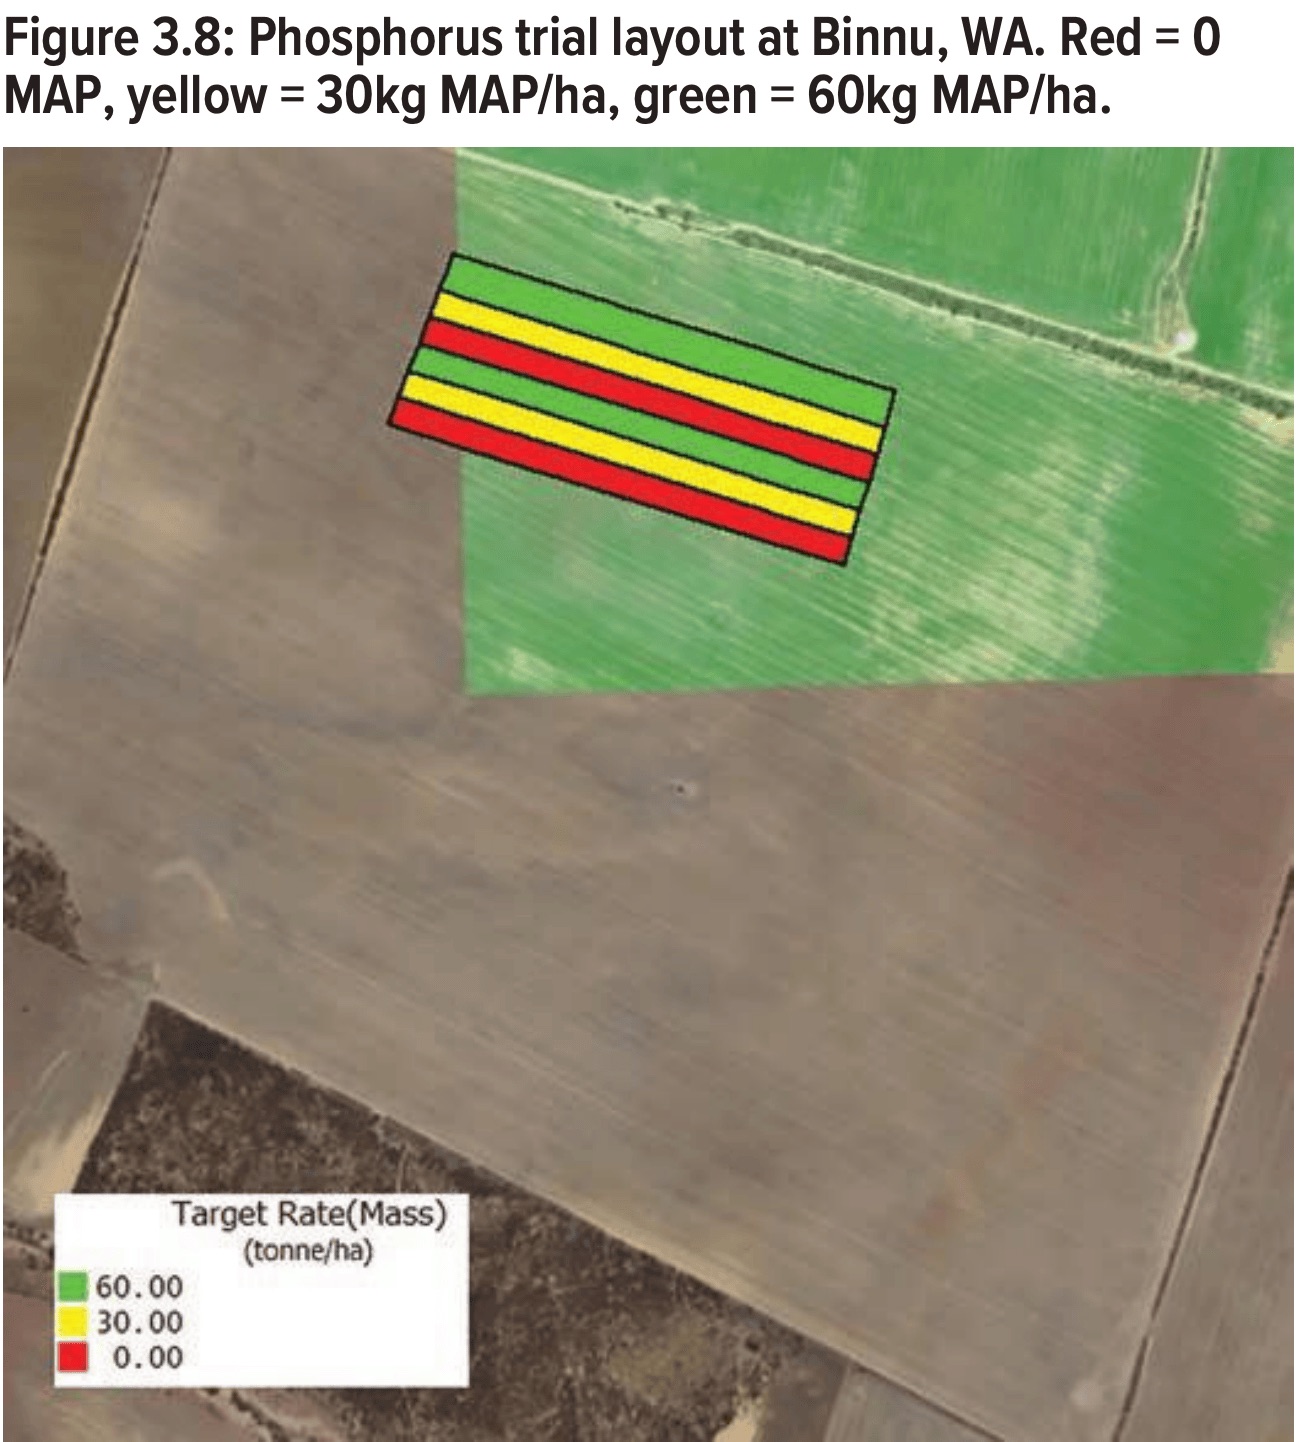
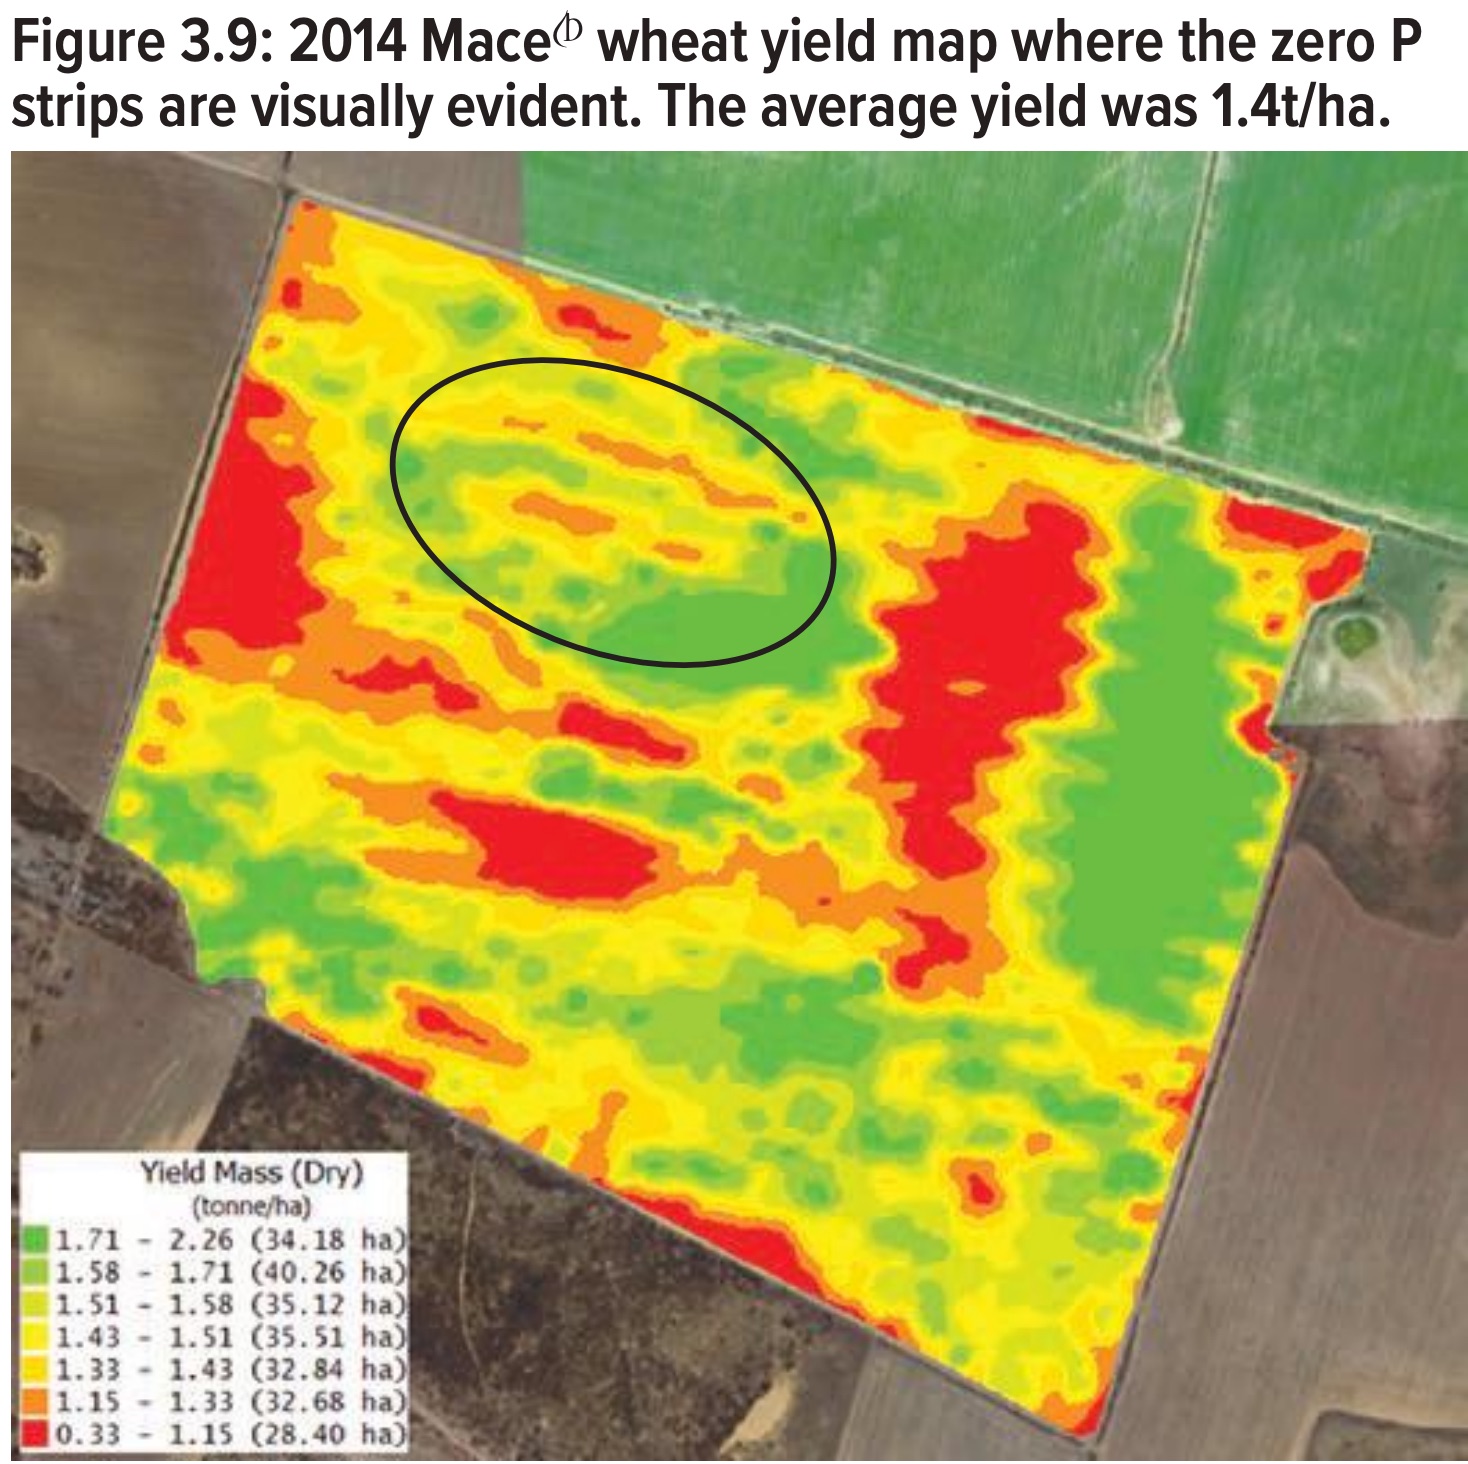
Fertiliser strip trials are experiments conducted in the field to assess the effectiveness of various fertiliser strategies on crop yield. By dividing a field into sections and applying different fertiliser rates, types, or methods to each, farmers can directly observe the impact on crop growth and productivity.
For instance, a trial might explore varying nitrogen rates on wheat, compare granular versus liquid fertilisers, or test precision fertilisation techniques like variable rate applications. These trials generate paddock data, enabling farmers to fine-tune future fertiliser applications. These comparisons allow strip trials to answer questions such as: What is the RIGHT amount, the RIGHT product and the RIGHT place?
Key Note: Trial strips need to be wide enough for at least two (ideally three) header runs for yield data collection. By ensuring three harvester widths for each treatment, there will always be at least two harvester run lines that fall completely within a treatment strip.
Strip trials generate paddock data, enabling farmers to fine-tune future fertiliser applications
Once the optimal product and rate for each zone have been identified, a full Variable Rate Application (VRA) map can be prescribed for that paddock.
The technical process of using VRA maps begins with converting these maps into controller files compatible with the machinery's onboard console. This is done using specialised agricultural software that can interpret the VRA map data and translate it into a format the machine's controller can understand. These controller files contain geospatial data that delineate the field zones and prescribe the exact rates of inputs for each zone.
Once the controller file is loaded into the machine's system, GPS technology guides the machinery across the field. The onboard computer reads the controller file in real time, automatically adjusting the application rates of the inputs according to the geo-referenced prescriptions on the map.
Soil Probe and Soil Modelling Software
Farm Management Software
Farm Connectivity
Agronomic Spatial Analysis Software
Control Console System